

|
stocks & Markets blog |
|
In keeping with my newly found tradition of starting these Blogs on Saturday Night, and then completing them on Sunday; I am about to crack on with this with a belly full of ‘Masterchef’ Chinese Takeaway (delivered obviously) and I have no doubt that many Readers in their Lockdown Lives will recognise the pattern of desperately trying to find something reasonably pleasant amongst our deserts of tedium !!
Of course I have shoved far too many plate fulls down my gullet (why does this happen? Normally my meals are just one plate, yet when any sort of takeaway or delivered food is involved, it becomes totally standard to eat crazy amounts – despite my intention being to save plenty for coming meals over the weekend), so this could be quite an uncomfortable spell of writing for me !!
Last Week
After a challenging end to February, the start of March seemed to be going quite well for me but then as the week tailed off, and especially on Friday, my Portfolio just slipped away rather painfully. In the end my Portfolio was up a mere 0.15% but I guess I ought to at least be happy that I did make a small gain (just about paid for that Chinese LOL). If you follow me on the Tweets and if you keep an eye on my ‘Trades’ page etc., then you may have spotted that I have done a bit of Hedging via Spreadbets on the FTSE100 and so far these are pretty much flat and not helping much. It is a tough one with regards to which Index is best for Hedging and in truth none of them are ideal, but the FTSE100 at least has some sort of domestic link. The trouble seems to be mainly emanating from the US Tech Index, the Nasdaq, and perhaps a Short on this would be the best idea; but it comes with the complication that it will move extremely fast and be very choppy. In theory the FTSE100 should move in a more controlled way but it runs the risk of Oil rising and pushing up the Big Oil Stocks (which have a hefty weighting in the FTSE100); and on top of this the Banks look like they want to rise and if they do, then they also have a big weight in the FTSE100. Having said all that, if things get really wobbly then I would expect pretty much everything to fall and that would include Oil and Banks etc. I am now 25% Hedged against my Long Portfolio of Stocks (this does not include my Income Portfolio, which I tend to view and treat as something entirely tangential) and I feel that is about right but I might add a tiny bit more Short if I feel the urge to. I won’t be buying anything (I don’t have any spare Cash and I want to conserve Cash if we are likely to go into a rocky period) and I am pretty much 100% Invested anyway in terms of Slots and Cash. It’s impossible to know how long any wobbles will continue and the depth of any drop if it does come to pass. It strikes me that the Nasdaq is extremely overvalued and, on that basis, it is not difficult to imagine a 10% drop on that Index and why not 15% or even 20%? Having said that, I suspect the UK Indexes might get off a bit lighter because they are relatively much lower anyway and the over-valuation is not of the same magnitude – in fact, much of the FTSE100 actually appears good value or even cheap; but that does not stop if falling if the overall mood of Markets sours. So really for me it is a case of biding my time and just letting my Portfolio tick over whilst I concentrate on just tweaking my Short Positions to try to reduce any damage and to be ready for the rebound, when it comes. Assuming we get a sell-off of course, but that looks almost 90% nailed on to me. I noticed the US ‘Stimulus’ package got passed through and that might give the Markets a boost early next week; but I suspect most of that is priced-in anyway as it shouldn’t be a surprise to anyone. Blog Slate Not much progress here because I am still not ‘fixed’ and I can see that situation dragging on for a while yet, much to my irritation. I did manage to update the ‘Monthly Performance’ page a few days ago with the entry for February and some text around it. It is already getting interesting to compare just the first 2 months of 2021 with the first 2 months of 2020 which you can find right at the bottom of that page. Over time I think a few years of such data will get very intriguing. In a few days’ time we should be heading to Abbey Road Studios to record TPI 44 (ok, it is not the ‘Studio’ you are probably thinking of and there are no Pedestrian Crossings near my house, or Peter C3’s) and that should be out for next weekend. In the meantime, if you have not heard it yet then you can find the most recent one, TPI 43, on the ‘Twin Petes Investing Podcast’ page or you can just click this link to get it on Soundcloud: https://soundcloud.com/user-479955511/conkers3-wheeliedealer-43-growth-vs-value-gme-ark-lloy-btc-cmlf-slp-smt-bnzl-beg-saga From the Archives All the Blogs I have ever written in way over 6 years can be found on the ‘Blog Index List’ page on my WD2 website, and from that list I bring you this archeological oddity: https://wheeliedealer.weebly.com/educational-blogs/how-i-manage-so-many-stocks Even I had to chuckle when I read the first few lines of that one !! Nasdaq Composite All the Charts I show are screenshots from the excellent SharePad software that I use and if you click on the images they should get larger on your screen, a bit. You can close them back down again by clicking or prodding the ‘X’ that appears in the top right hand corner. If you fancy using SharePad or ShareScope yourself, then there are ‘adverts’ all over my websites whereby you can click through and get one month’s Free Data when you sign up. I also get a small payment from SharePad so thank you very much !! The Nasdaq seems to be the main culprit with this potential sell-off, and for that reason I will start by looking at the Charts for that one. I won’t show the Monthly Candles this time, but if you look back at the ‘Stocks & Markets Blog’ I did for last weekend, then you should find them there and they look ropey on most Indexes. This was a key reason for me putting those Shorts on. First up we have the Weekly Candlesticks for the Nasdaq Comp and my Blue Arrow is pointing to a Black Down Candle for last week but note it did manage to Close up off the Low at 12397, which now becomes Support. On its own, this Candle looks Bearish and my Black Ellipse is highlighting a Zone of Support running from about 12000 down to 10500 – that gives a sense of how far a drop could go. If things do get worse than that, then the area around 10000 is likely to be good Support. 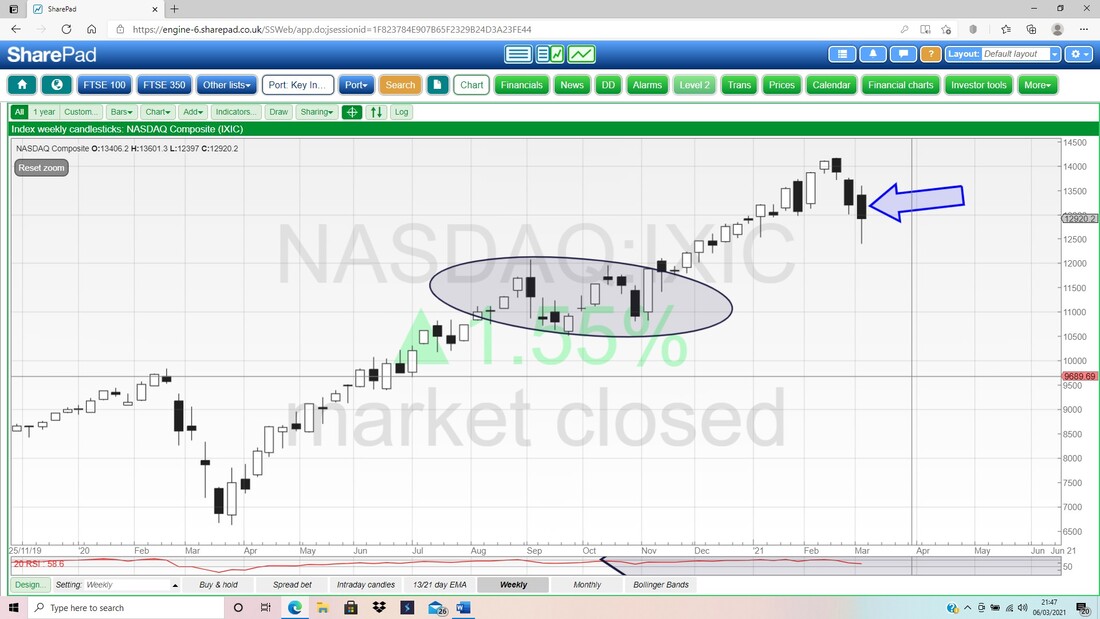
My next screen for the Nasdaq Comp has the Daily Candlesticks but I am not really looking at those yet (they have some interesting tales to tell !!). My focus here is on the Black 13 Day EMA Line (Exponential Moving Average) and the Red 21 Day EMA. My Red Arrow is pointing to where these did a ‘Bear Cross’ and that potentially could mean several weeks of downside.
These Bear Crosses and the opposite, a ‘Bull Cross’ (see my Green Arrow) tend to be pretty reliable but they can give ‘False’ Signals sometimes and this happens when a Price moves sideways. I get the hunch that won’t happen this time, but we need to see how the next few days play out. If you follow me on Twitter, no doubt I will be sending out Tweets about the Technicals on the Markets most nights after about 10pm UK time. 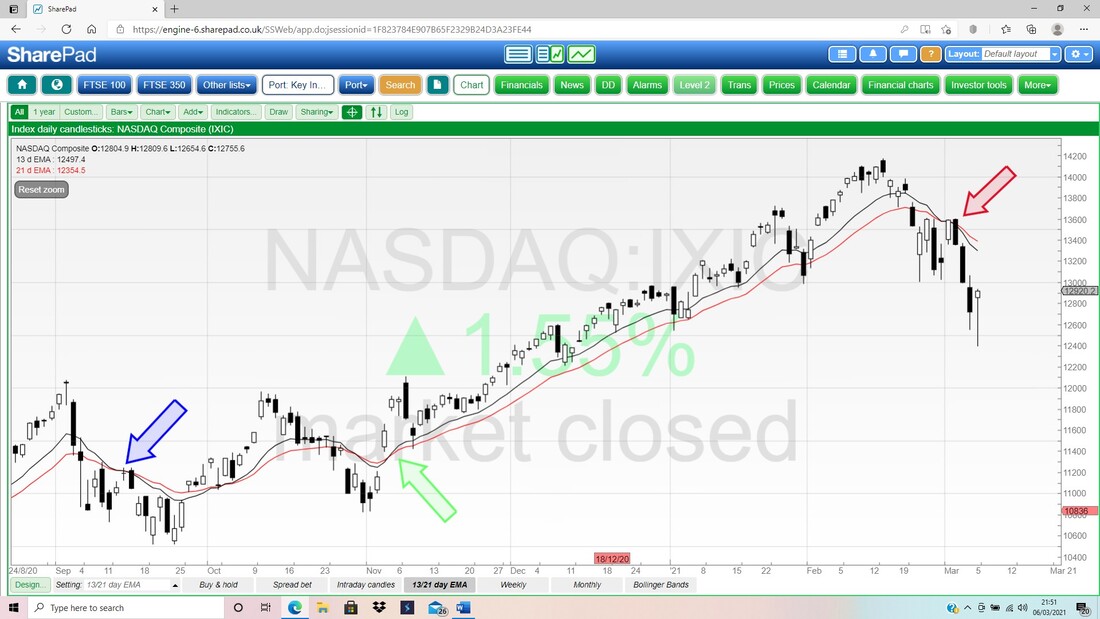
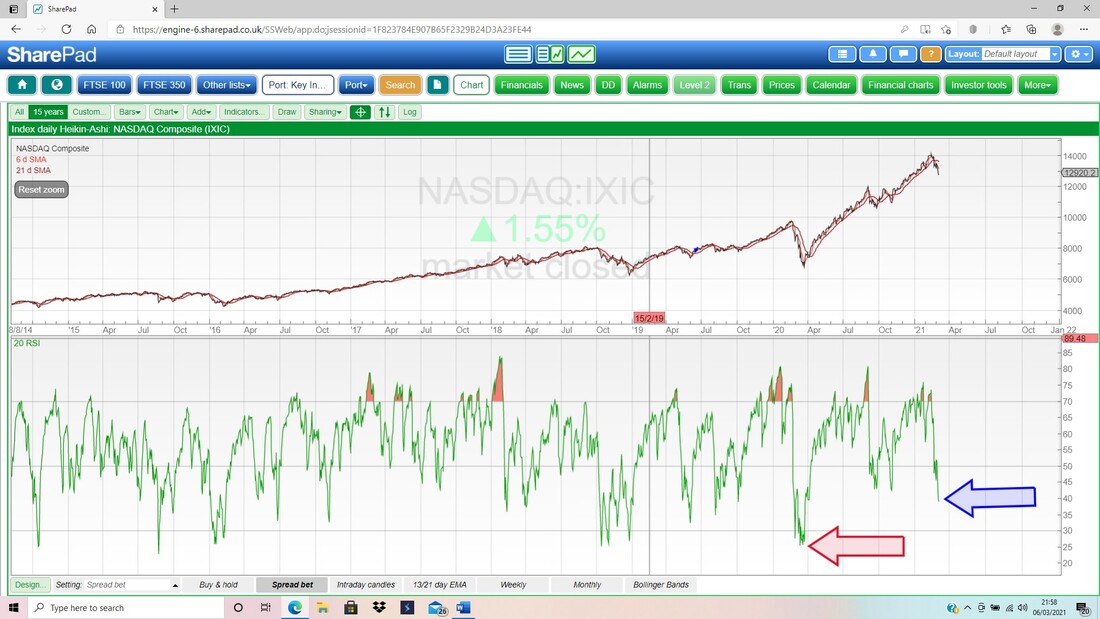
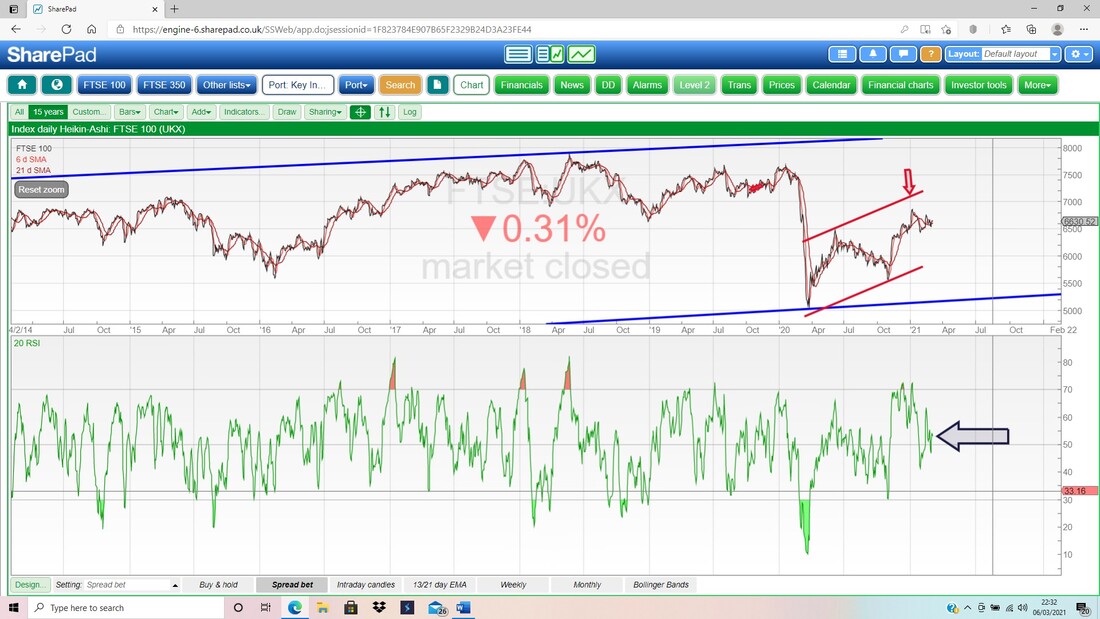
In the bottom window on the Screen below, we have the RSI (Relative Strength Index) for the Nasdaq Comp Daily and my Blue Arrow is pointing to a level of RSI 39 which is heading down but not ‘oversold’ yet; and my Red Arrow is pointing to where it recently got down to RSI 25 which was in the heavy sell-off of March 2020 – I wouldn’t expect things to get that ugly.
Last up for the Nasdaq Comp we have the Daily Candles with the Pink Zone marking the Upper and Lower Bollinger Bands. My Blue Arrow is pointing to a very pretty ‘Hammer Reversal’ Candle from Friday and we should see the Nasdaq Comp move up from here at the start of the coming week.
However, my suspicion is that if we do see a bounce next week, it will move up to near the Red Line which marks the Bollinger Bands Midpoint - and my Red Arrow is pointing at this at 13250. If it can get above this, then there is Resistance at 13600. The Upper Bollinger Band is at 13835 and to the downside the Low from Friday is at 12397 and note how it recovered Intraday from ‘outside’ the Lower Bollinger Band, which is always an unstable condition. 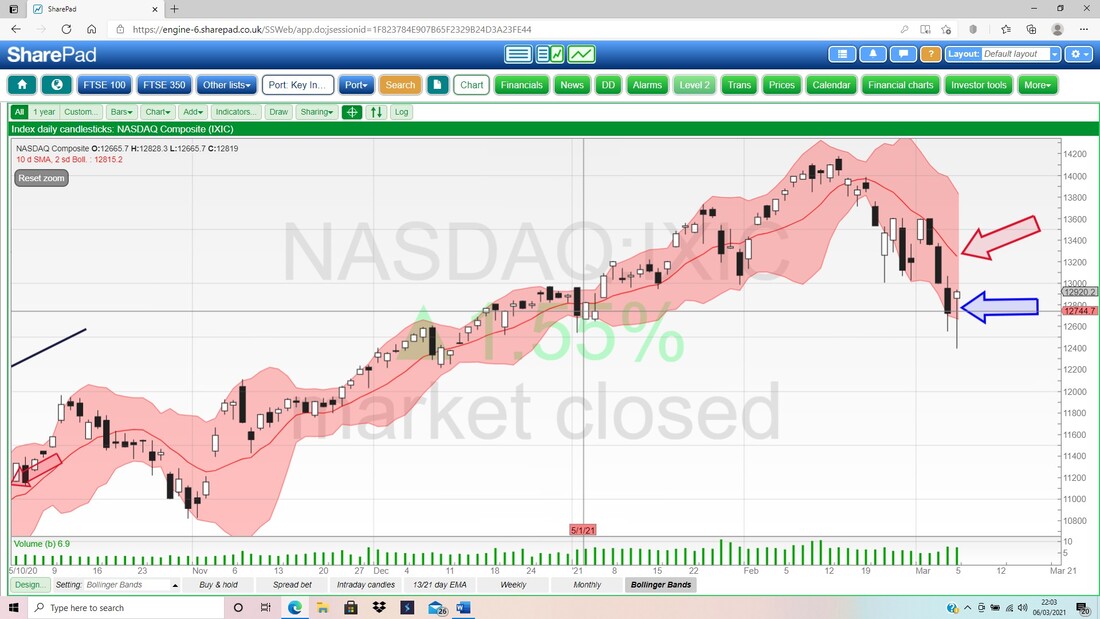
Brent Oil Composite
Oil has a big impact on the FTSE100 and therefore the Shorts I have running. First up we have the Weekly Candles for Brent Oil Comp and my Red Arrow is pointing to a nice Big White Up Candle from last week and this looks bullish. My Black Arrow is pointing out Resistance at $71.3 and then my Blue Arrow is marking Resistance at $75.6 and then my Blue Ellipse is highlighting Resistance at $86.7. To the downside, there is decent Support at $60, $55, $50. 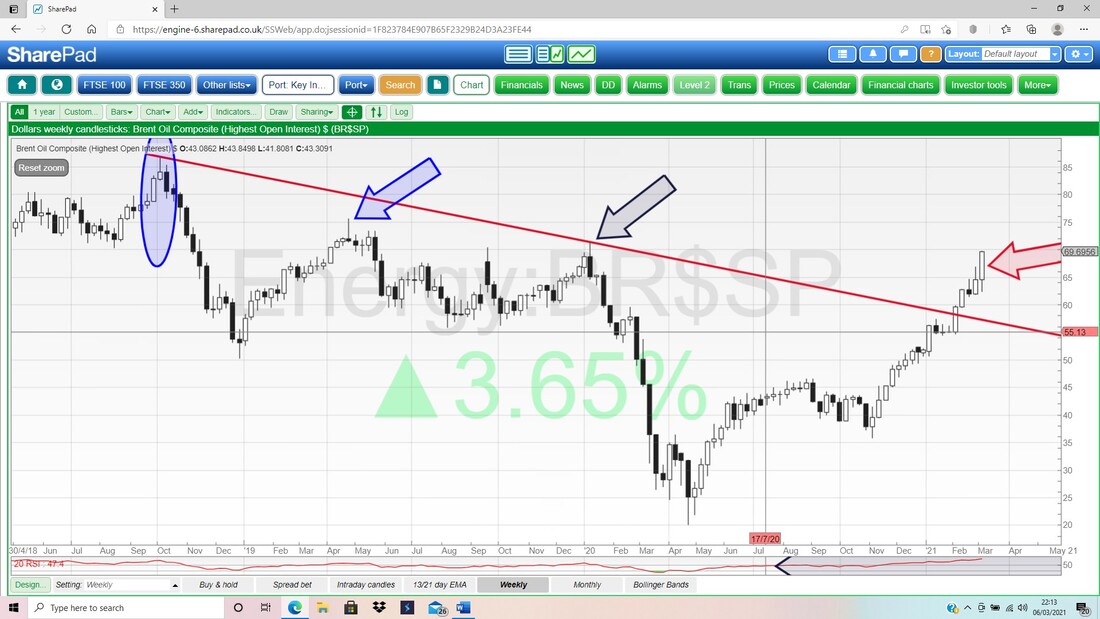
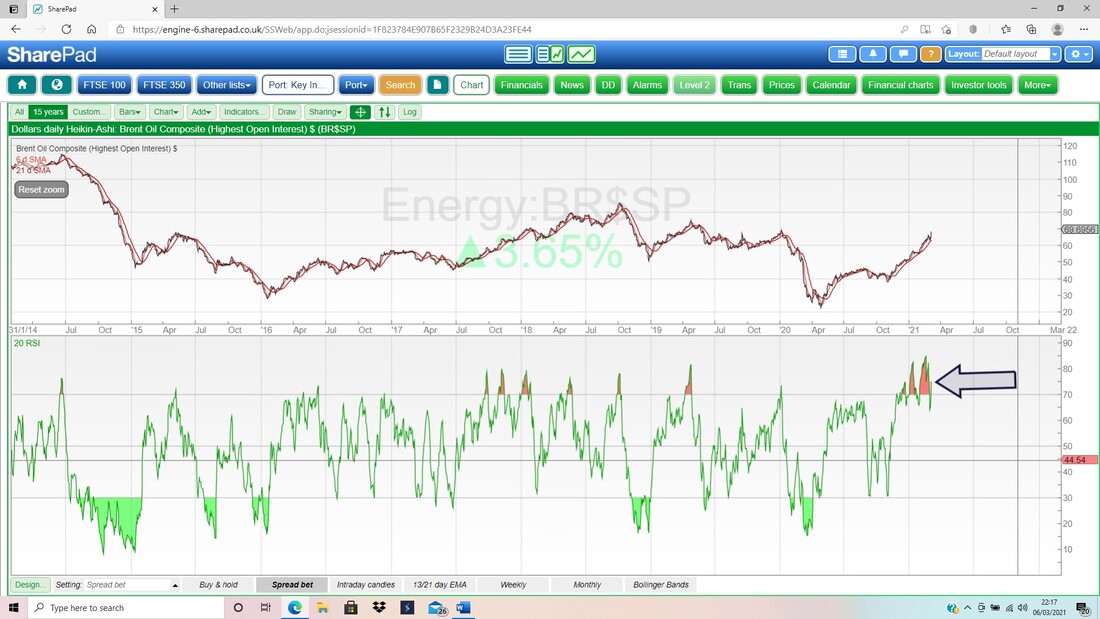
In the bottom window on my Screen below we have the RSI for Brent Oil Comp on the Daily and my Black Arrow is marking a Reading of RSI 75 and this is extremely high and suggests some sort of pullback or sideways consolidation is needed very soon.
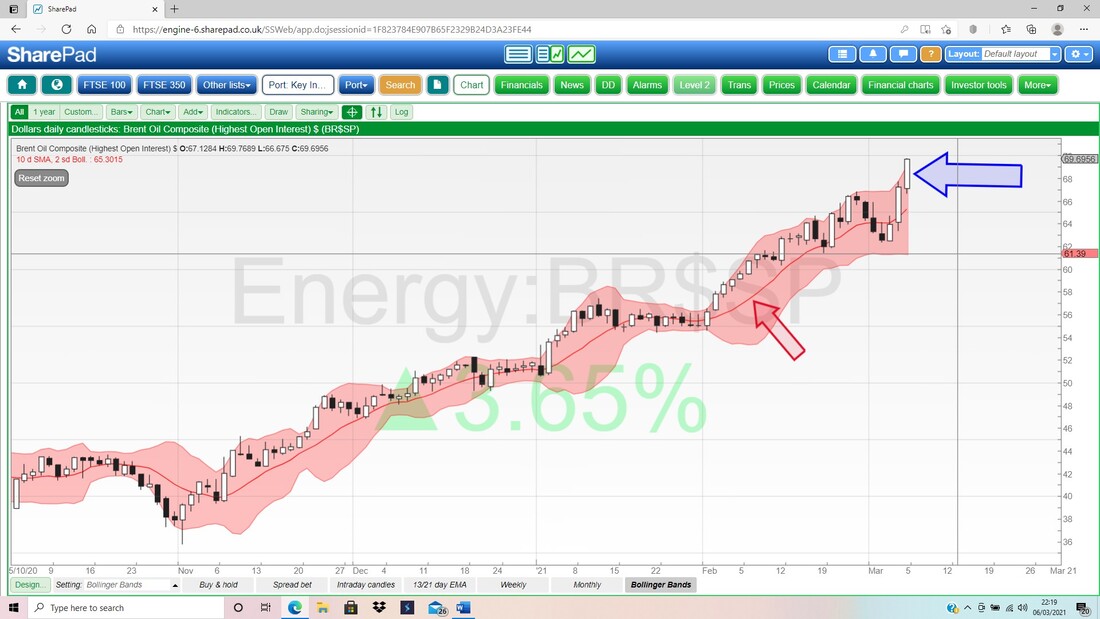
Finally for Brent Oil Comp we have the Daily Candles with the Bollinger Bands. My Blue Arrow is pointing to a Big Up Candle and note this is right up at the Top Bollinger Band and could mean some consolidation is needed. Down below we have the Red Midpoint Line at $65 (Red Arrow) which could be Support and down below the Bottom Bollinger Band is at $61.4.
FTSE100
Firstly, we have the Weekly Candles for the FTSE100 and my Blue Arrow is pointing at a pretty nice looking White Up Candle for last week which covers the Down Candle from the week before. However, this is all about Support and Resistance and the Key Resistance here is where my Black Arrow is at 6800 and above that we have my Green Arrow at 6900. The High from last week was at 6711. Down below there is Support at 6315 then 6263 and a big Zone of Support where my Black Ellipse is. 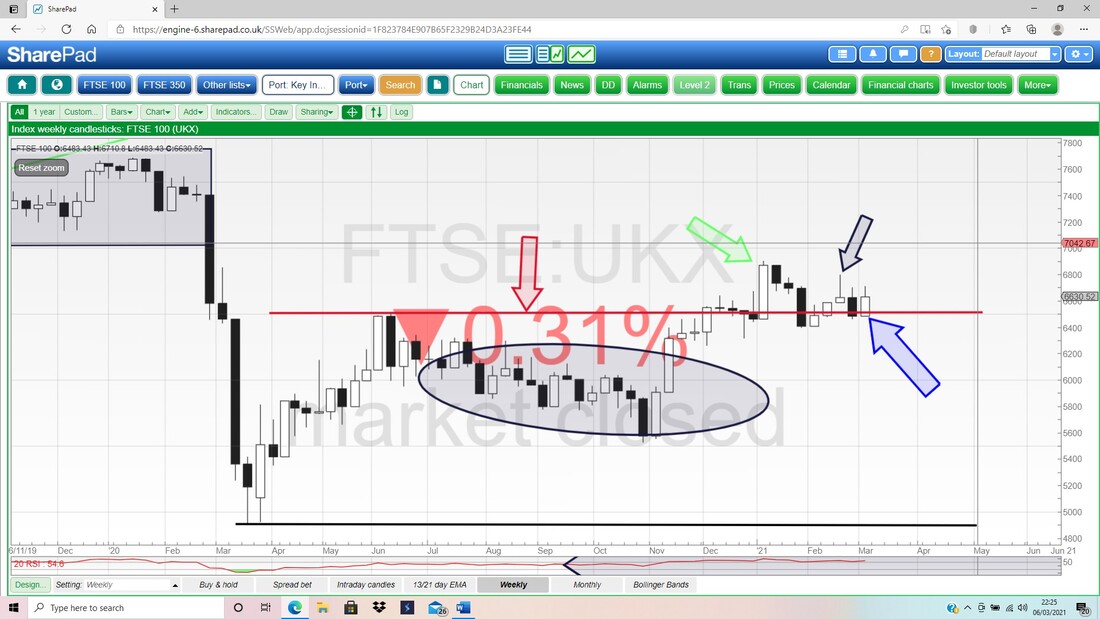
This screen is a bit busy but try to focus on the Black 13 Day EMA Line and the Red 21 Day EMA Line. My Blue Arrow marks a ‘Bull Cross’ on these and if you look closely at the lines, you should see that the Black 13 Day is just above the Red 21 Day Line. However, it wouldn’t take much weakness to tip this bearish.
I am not overly comfortable with defying the Signal from these Lines (these Lines are still in ‘Bull’ mode and by being Short I am going against them) but with other Indexes looking a bit dodgy, I suspect the FTSE100 will fall with them if things do get messy. The key thing is that I am watching my Hedges closely and if I sense a need I will Close them fast. 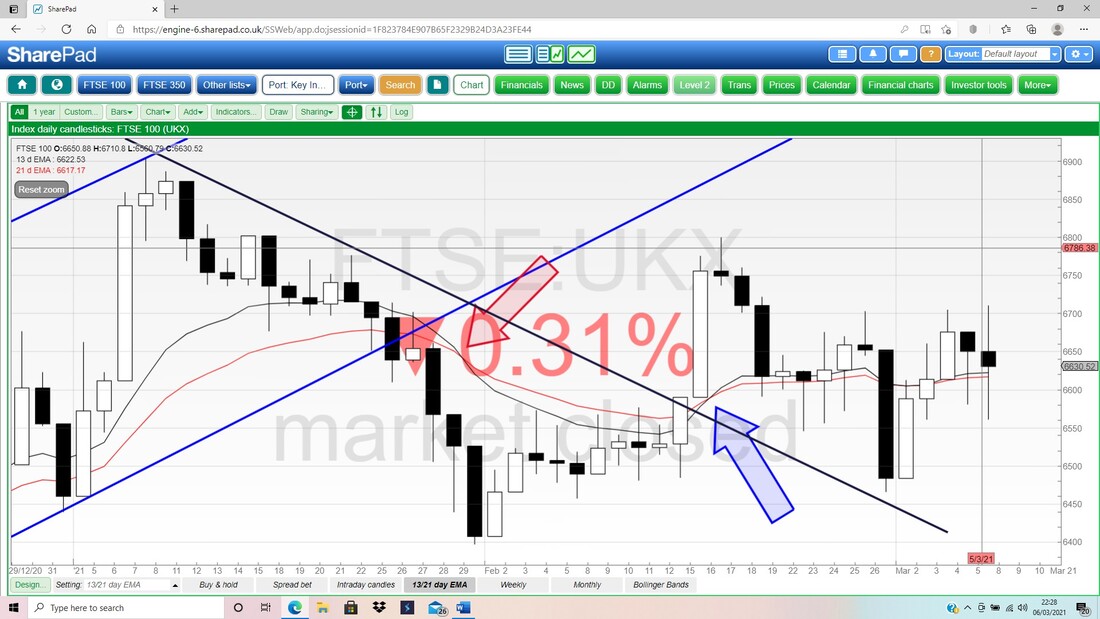
In the bottom window below we have the RSI for the FTSE100 Daily. My Black Arrow is pointing to a Reading of RSI 53 which is pretty much Neutral. Note, such ‘neutrality’ is consistent with what we saw on the 13/21 Day EMA Lines which are pretty much fixed together.
Last up for the FTSE100 we have the Daily Candles and the Bollingers. My Blue Arrow is pointing to a ‘Long Tails Doji’ from Friday and look how it swung around; not unusual on a Friday which can throw up all sorts of weird behaviour (especially as we had the ‘US Non-Farm Payroll Numbers’ which were hugely better than expectations).
The High on Friday was 6711 and the Low was 6560. Look how the Bands are quite close together and for the last few weeks, the FTSE100 has been quite sideways. 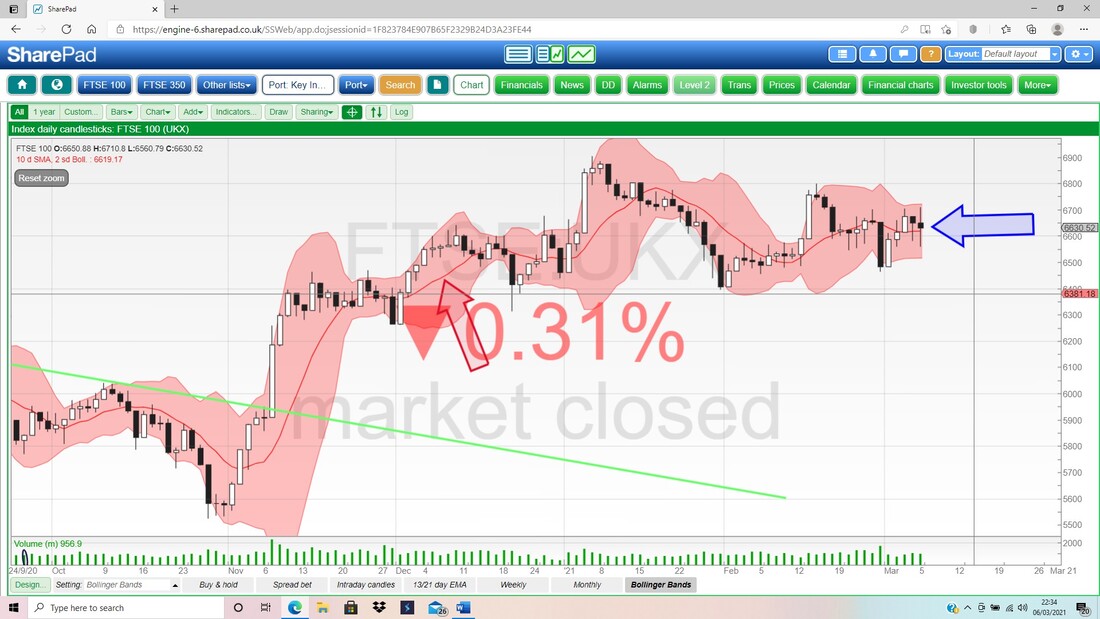
FTSE250
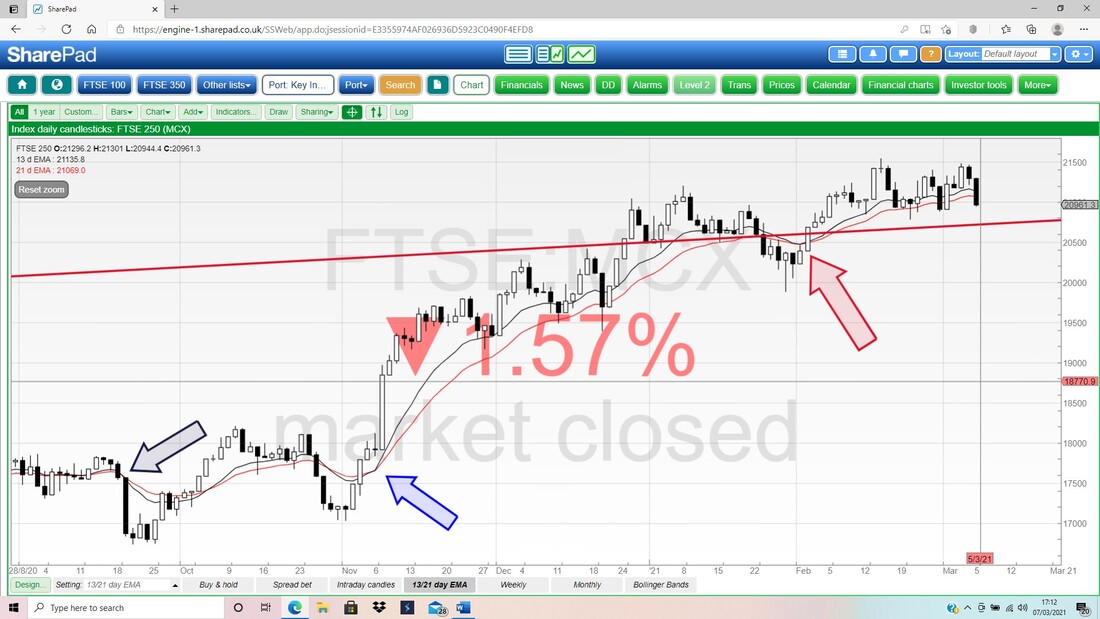
I am going to sling in a few FTSE250 Charts as a bit of a bonus. I actually wrote all of this blog so far on Saturday night and upon revisiting and proof-reading on Sunday, I decided to look at the FTSE250 and see how that was shaping up. First up are the Weekly Candles and my Blue Arrow is pointing to a succession of Upside-Down (Inverted) Hammers or perhaps ‘Shooting Stars’ although the context is poor for the latter (a valid Bearish Shooting Star would appear after a strong move up of several Candles – these are going sideways). It is unclear what to make of these and all we can tell is that for several weeks now, the FTSE250 has been unable to hold its Weekly High and has dropped back. Look across to the top Left-Hand Corner where my Red Ellipse is and that is marking quite strong Resistance and maybe that Zone is holding the FTSE250 back at the moment. On the positive side of things, it is good how the FTSE250 has managed to stay within the Uptrend Channel marked by my parallel Green Lines. 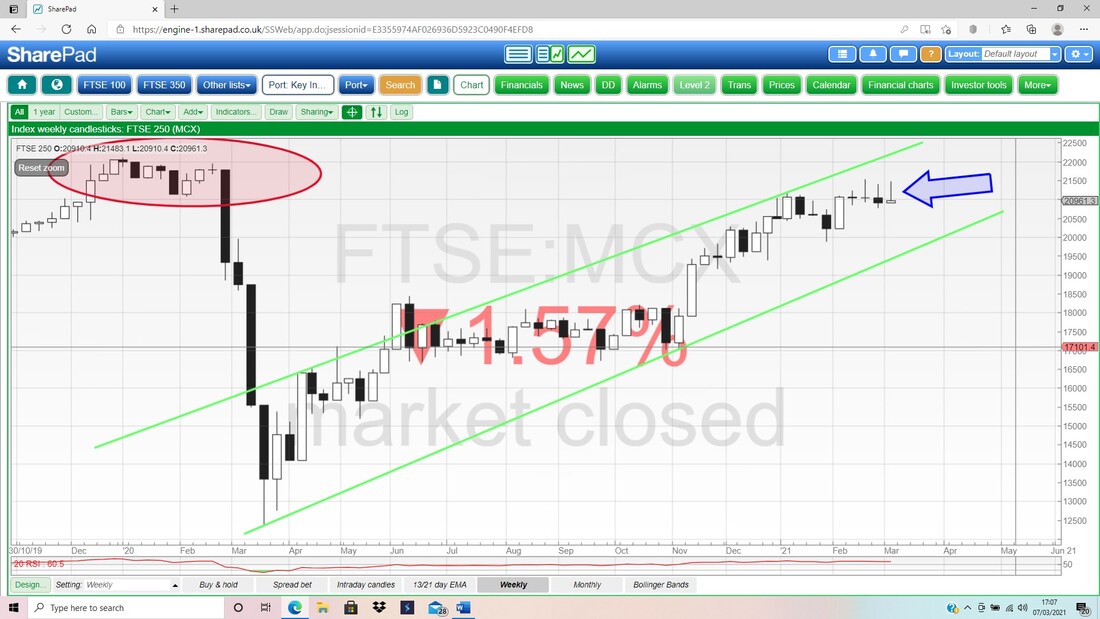
Next we are looking at the Daily Candles for the FTSE250 but with a focus on the 13 and 21 Day EMAs. My Blue Arrow is pointing to a ‘Bull Cross’ on these EMA Lines and note how we nearly got a ‘Bear Cross’ where my Red Arrow is, but we managed to dodge it. The Lines are still bullish at the moment but it wouldn’t take much weakness to trigger a Bear Cross.
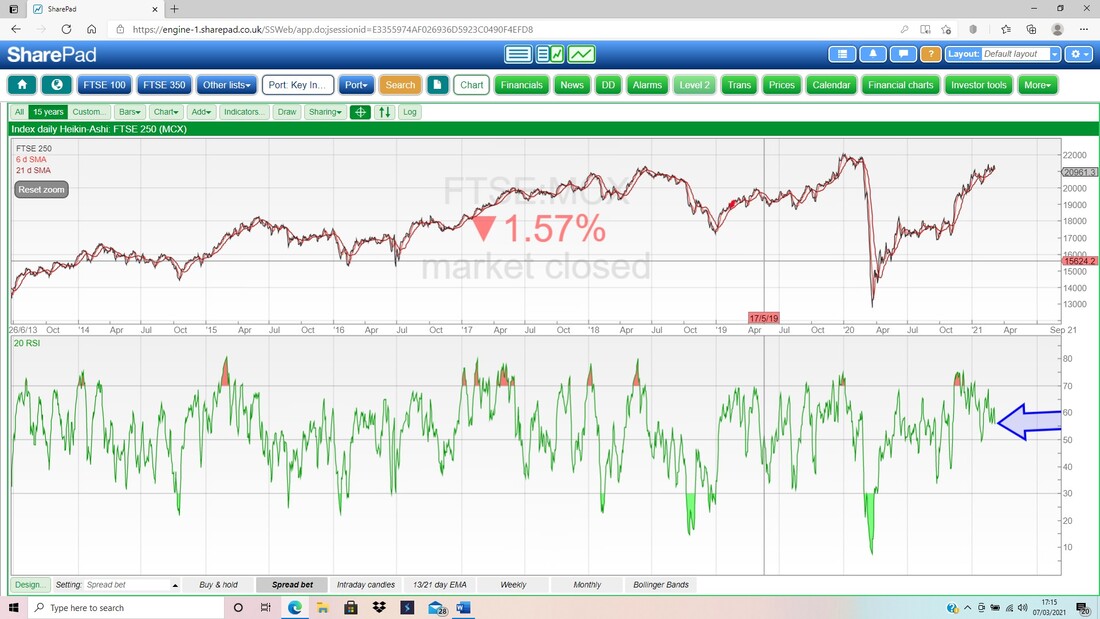
In the bottom window on the Screen below we have the RSI for the FTSE250 Daily. On a Reading of RSI 56 this is getting down to near Neutral (makes sense with the FTSE250 going pretty much sideways for weeks).
Finally we have the Daily Candles for the FTSE250 with the Pink splodge marking the Bollinger Bands. My Blue Arrow is pointing to a Big Down Candle from Friday but note this is still really just sideways within the Bands.
However, there is actually something we need to be really careful of here. Whenever the Bollinger Bands tighten up and do a ‘Squeeze’, then it can resolve in an EXPLOSIVE move. We cannot know in advance which way it will move, but when it comes expect something big. My hunch would be that after such a strong run up, and with this time of year often a bit wobbly, the chances are more weighted to downside than upside. OK, that’s it for this week. Best of Luck for the coming week (you might need it !!). Regards, WD. 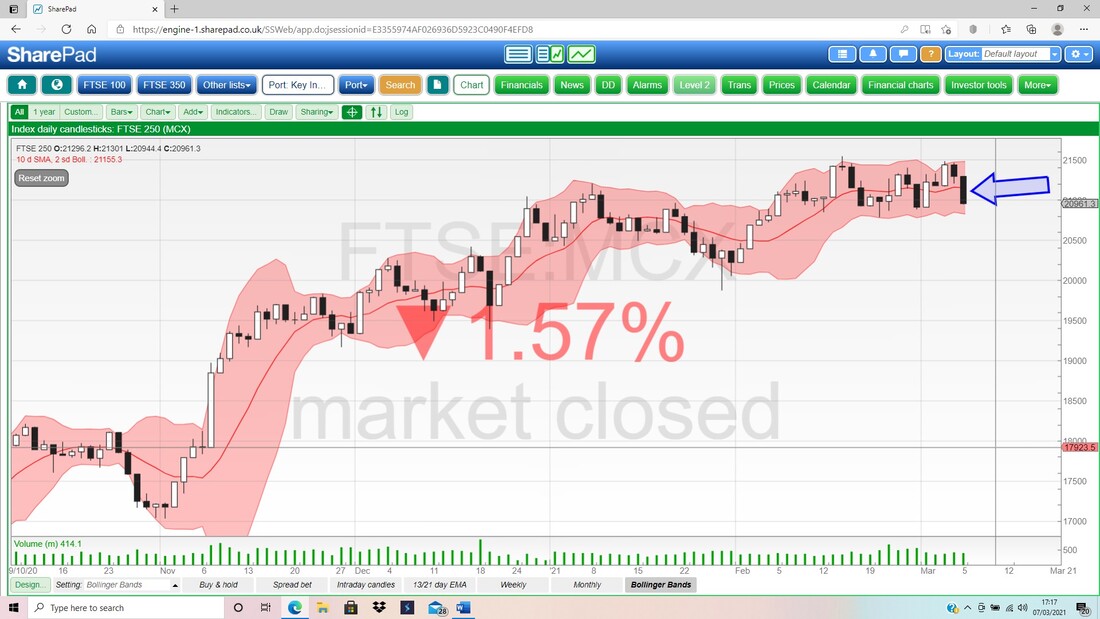
2 Comments
MarkRed
3/12/2021 06:51:36 am
Hey. Just wanted to thank you for the website and the content. It is fantastic stuff. I have been investing for years with trackers but decided I wasn't getting the full benefit that the stock market gives us so I have started to research trading individual stocks. I have been reading Michael Taylor and yourself. There is so much to learn but I wouldnt be able to do it without resources like yours so thank you.
WheelieDealer
3/16/2021 02:08:06 pm
Hi Markred (I guess you are known as Mark !!), Thank you so much for taking the time to give your feedback and I hugely appreciate the encouragement and support of what I get up to. Leave a Reply. |

Stocks & Markets WheelieBlogsThese tend to be more Markets and Stocks related and timely - the Blog Page on the Main WheelieDealer Website has the 'Educational' stuff (well that's the theory anyway !!). Archives
October 2021
Categories
All
|
