

|
stocks & Markets blog |
|
This weekend we held what I think was the 6th WheelieBash and yet again our incredible run of decent weather continued; the rain kept away although it did get a bit nippy at times but fortunately the attendees seemed to have had the good sense to bring Jumpers and Jackets !!
As always I must thank Aston Girl @Reb40 for the timing because we always set the date on when it fits her to fly down south and that tends to be early September (and I must also thank AG for making the effort to come such a long distance anyway !!). It was a slight shame we picked the date slightly wrong because it has turned out that Sunday has been pretty nice down here in Windsor and I have been able to get out in the garden doing some of the essential tidying up that always comes as Autumn descends upon us.
It was a bit of a subdued event this year because of the Virus stuff and we were limited to 30 people but I didn’t really make a song & dance about it and we had about 22 people turn up. It went really well though and as usual the people who were there seemed to have a good time and nobody was rushing to leave !!
We had a mix of ages, abilities, backgrounds, sexes (should that be genders?), drinking preferences, eating habits, hairstyles etc. As usual there were no egos around and everyone just got on with the socialising (within the Social Distancing limitations !!) and I suspect many people will have come away not only having had a good time and a good giggle, but also having learnt something or perhaps been introduced to new approaches or new Stocks to look at etc. No doubt many friendships have been started and cemented. I really was in a quandary about whether or not to go ahead with The Bash this year but as things started to open up, and after a discussion with Phil the Landlord at The White Hart, I decided to go ahead but with that limit on numbers. Fortunately we were able to use the wonderful garden because the weather held out and Phil was very pleased to hold our gathering and commented on what a friendly and pleasant bunch of people we always have. Despite the concerns around C19 it was really nice to keep a wonderful tradition going and I am most definitely looking forwards to having a big Bash in 2021 and I am pretty sure the turnout will be very sizeable on the assumption that C19 is long since forgotten and people will be very eager to resume a more normal existence. Several people had mentioned to me that they wouldn’t come this year because they were a bit worried about the Virus stuff and that is very understandable. If you follow me on the Tweets you may have already seen some of the Photos that were taken of the Bash and when I find the time I will update the ‘Events’ page with these Pics to keep the guilty in the spotlight !! Last Week Well, with the Markets going a bit more ‘Risk-off’, my Portfolio took a hit and I was down 2% for the week which means I am down 2.9% since January 1st. It is a bit frustrating to have gotten so near Breakeven again but I am pretty relaxed about it and I have been saying for a while that some sort of Autumn drop was going to come along, and at least I had a small Short in place to help Hedge my Portfolio a bit. I added to the FTSE100 Short on Thursday Night and my expectation is that we will see more downside in coming days/weeks and I will most likely be putting another Short on one Evening this coming week. We shall see and I will be driven by the Charts. So boringly enough, my Strategy is unchanged and I am not doing much buying with my Dosh pretty much fully invested and all my Slots filled and my focus is on Shorting to try to limit any downside from a general bad mood in the Markets. My hunch is that any drop won’t be as bad as back in March and I will be tracking the moves closely with an aim to Closing any Shorts at an opportune time and then looking to go Long on an Index to catch any upswing. If I can play it that way then I should make a bit of Money on the downside, and a bit on the way back up. Easy to say of course but difficult in practice. As ever I will be Tweeting out what I am doing and if you go to my ‘Trades’ page on WD1 you will see what I am up to. Something I have picked up on is that the number of C19 infections seems to be increasing around the World and maybe that will become a bit of a ‘thing’ and set the media narrative to explain why Markets are falling. Remember, the Market always has to have a good reason and saying “The Markets dropped because they had run up too far” doesn’t fill much time on the schedule. It also is a bit too simple and the last thing the Finance Industry wants to do is make Investing and Trading seem like something anyone could do if they bothered to learn the ropes. It could be that we hear talk of ‘Second Wave’ a lot more. Blog Slate I published an ‘Educational Blog’ on WD1 a few days ago which talks about the idea of reducing your ‘Opportunity Set’ and getting focused and specialised – that is certainly the direction I am going in and I think it will prove beneficial. I also started work on another Blog which is in a similar vein and carries on where the first one left off really. I stumbled over a Blog Idea on Friday Night about how a Spreadbet Account works in terms of the mechanics of it all and that should be a very easy and quick one for me to write. I often get asked this same string of questions by people when they first start Spreadbetting so if I write the Blog it will probably save me a lot of responses as I can just point people in the direction of the Blog !! It should be quite effortless to write so I might crack on with that one soon. Other than that I think we will be due to go to Abbey Road to record TPI 31 and if you have not listened to recent Podcasts then skip over to the ‘Twin Petes Investing Podcast’ page and you can play them all directly from that page. From the Ossuary With the Markets being a bit grumpy it seems appropriate that I chuck this old Classic out again because many newer Readers might not have endured it yet. As always, all the Blogs I have written in the past can be found on the ‘Blog Index List’ page (yeah, I have no idea why I called it that either !!) and there are Links to all the Educational ones: https://wheeliedealer.weebly.com/educational-blogs/taming-the-bear-how-i-handle-nasty-markets And I also found this one which Readers might like to revisit: https://wheeliedealer.weebly.com/educational-blogs/a-2-minute-blog-on-bear-market-rules And this one might be worth reading: https://wheeliedealer.weebly.com/educational-blogs/over-reactions-exaggerations-and-chronic-short-termism Right, on to the Charts which have garnered a bit more significance this Weekend….. Nasdaq Composite As usual all the Charts I show are Screengrabs from the excellent SharePad software that I use religiously. If you click on the pics they should get a bit bigger on your screen so you can see more detail. I have mentioned a lot lately how the Nasdaq has been fascinating me because it had so obviously run up too far and this was particularly evident in extremely high RSI Readings (Relative Strength Index) and the simple observation that the “Chart had gone vertical”. In addition, from a fundamentals viewpoint the valuations have started to look quite silly and with Autumn upon us, some sort of Pullback seems highly likely. Having said that, I think it is very possible that the Nasdaq will be higher than even the recent peak when we get to December 31st but I can’t see it getting there without a significant drop to calm all the rampant Bulls down (throw a bucket of ice cold water over them). On top of this we have a fractious Presidential Election not far off and plenty of worries about the Virus. Needless to say, the Nasdaq got a good spanking on Thursday but on Friday (prior to a long weekend in the States with the Markets shut on Monday), there was a huge Hammer Reversal which I will show in a bit. So it will be interesting to see what the Charts suggest will be coming along next. My first Chart shows the Daily Candlesticks for the Nasdaq Comp but my main focus here is the Black 13 Day EMA Line (Exponential Moving Average) and the Red 21 Day EMA Line. Where my Blue Arrow is we had a ‘Bull Cross’ where the 13 Day crossed over the 21 Day and this has been in force for months and shows how following the Signals from this Cross could have kept you in a Long Trade for months (and of course made you a lot of smackers !!). This Indicator is still in ‘Bull Mode’ but we need to be on our guard for a ‘Bear Cross’ where the Black 13 Day EMA drops through and below the Red 21 Day EMA and I suspect this could very well happen soon. We had such a Bear Cross back in late February if you look at the Chart. My Black Arrow is pointing out a ‘Hanging Man’ Candle which has been a Turning Point from which the Nasdaq pivoted down on Thursday (I highlighted this on the Tweets on Wednesday Night) and my Blue Ellipse is showing the Hammer Reversal which is a beauty really and a big turnaround. I would expect the Nasdaq to try to move up from this Hammer but if it does manage it, I suspect it might fall away quite soon. I would be really surprised if the Nasdaq can keep going up in the short term and take out the High from Wednesday (a New All Time High) at 12074; and to the downside we need to watch Support from Friday at 10875 and if that fails then things could get a bit painful because weakness in Tech will drag down the S&P500 and the DOW and probably hit UK and European Markets as well. 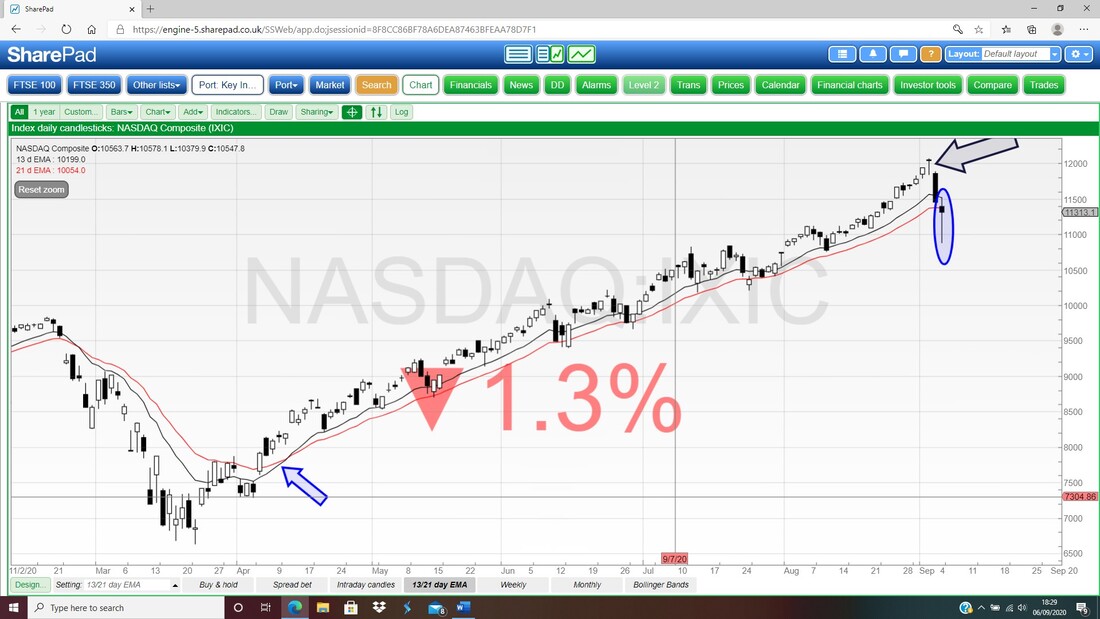
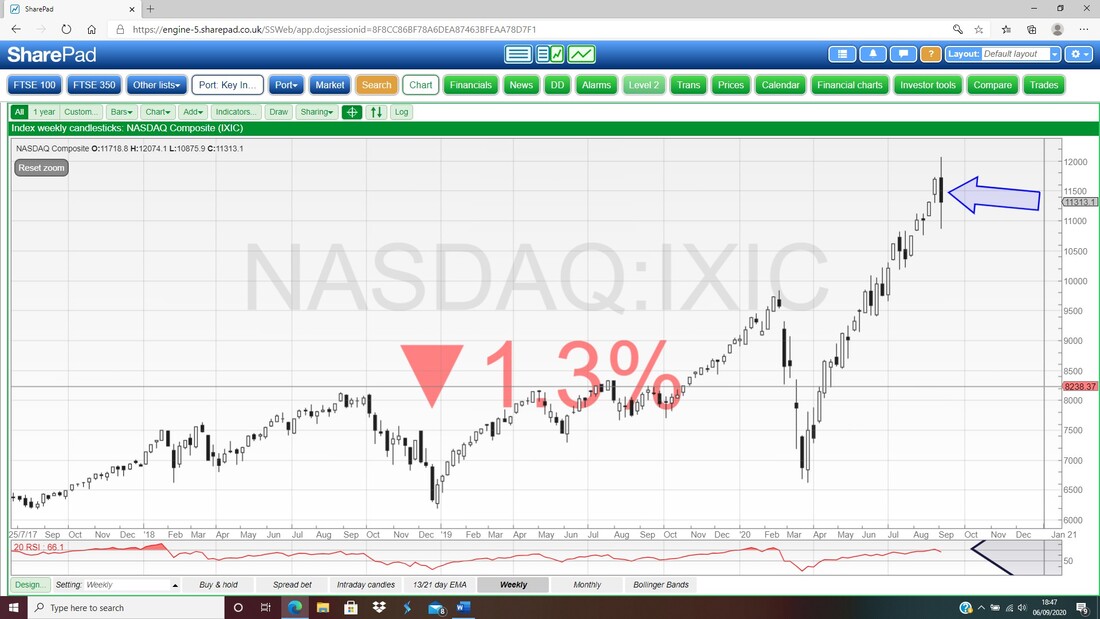
Next we have the Weekly Candles for the Nasdaq Comp and my Blue Arrow is pointing to a ‘Bearish Engulfing Candle’ from last week which also has long ‘Tails’ which shows how choppy it was. My suspicion is that much of the Reversal from Friday was down to the long weekend and Traders closing out Short Positions because they didn’t want to carry them over the weekend. To close a Short you have to buy back so that creates a lot of buying pressure.
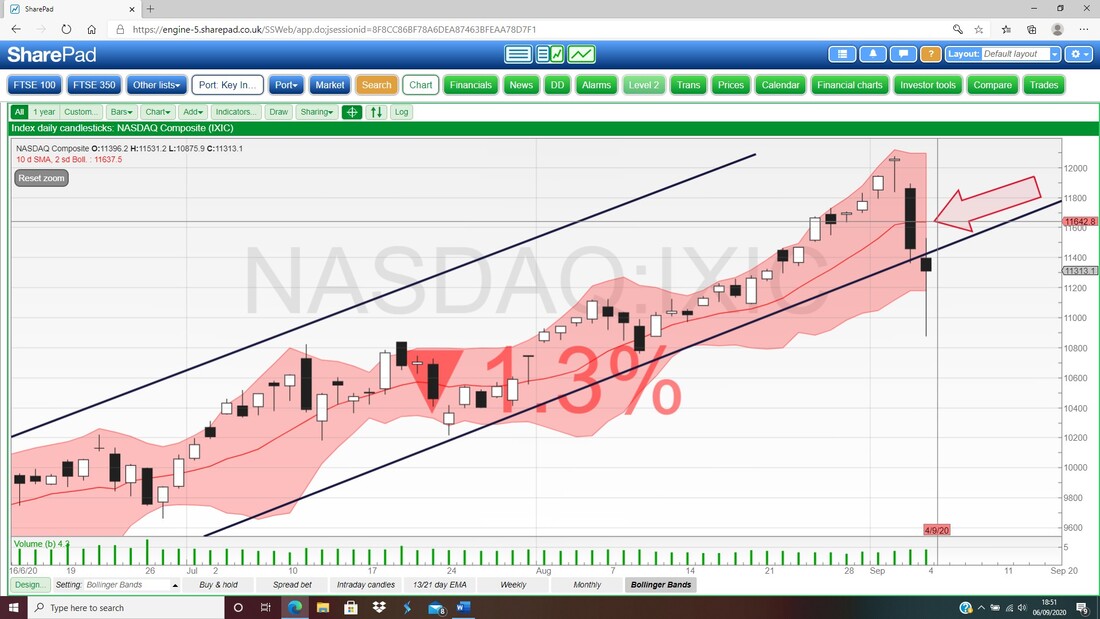
My next Chart has the Daily Candles for the Nasdaq Comp with the Pink Zone marking the Bollinger Bands. First off notice how the Hammer from Friday went well outside the Bottom Band and this is very unstable so some sort of Reversal was quite likely for Day Traders I suspect. My Red Arrow is pointing to the Bollinger Band Midpoint Line and this is at about 11640 and we might find that any move up next week runs out of puff at this Level.
I was really fixated on the Daily RSI (Relative Strength Index) for the Nasdaq Comp last week and in the bottom bit of the Screen below we have that RSI. My Blue Arrow is pointing to the recent High and this was up at about RSI 81 which was not far off the Peak where my Red Arrow was at RSI 84 and note this was the highest Reading on my Chart which goes back 15 years on SharePad !! With such an extended move up it was pretty obvious a drop was coming very soon (as I pointed out on the Tweets).
My Black Arrow is pointing to where we are now at about RSI 55 and this seems like a level the Nasdaq Comp can move up from (this is consistent with what the Hammer Reversal suggests) but my sense is that we will see more weakness in coming Days/Weeks. 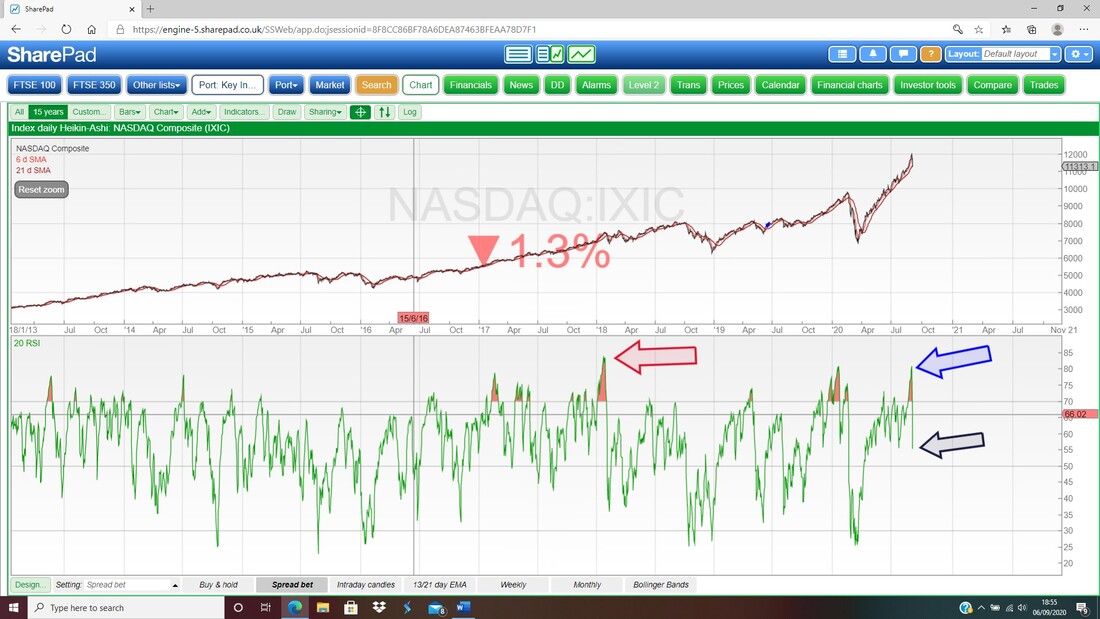
The S&P500 and DOW are likely to follow what the Nasdaq does so I won’t show them this week.
Brent Oil Composite This is quite an interesting situation as well. My Chart below has the Daily Candles for Brent Oil Comp and the first thing I notice is how the Price has turned down from Resistance around the 200 Day MA (Moving Average) Line which I have pointed at with my Blue Arrow. This is currently at about $45.6. On top of that, the Price has fallen through the 50 Day MA Line (this is the Darker Blue Wiggly Line) and my Black Arrow is pointing to a big Down Candle from Friday which looks pretty Bearish. There is Support here at $42.3 and below that we have Support at $41.8 from the Hammer Candle where my Green Arrow is and below that we have good Support at $40. I get a real sense of foreboding about this Chart !! 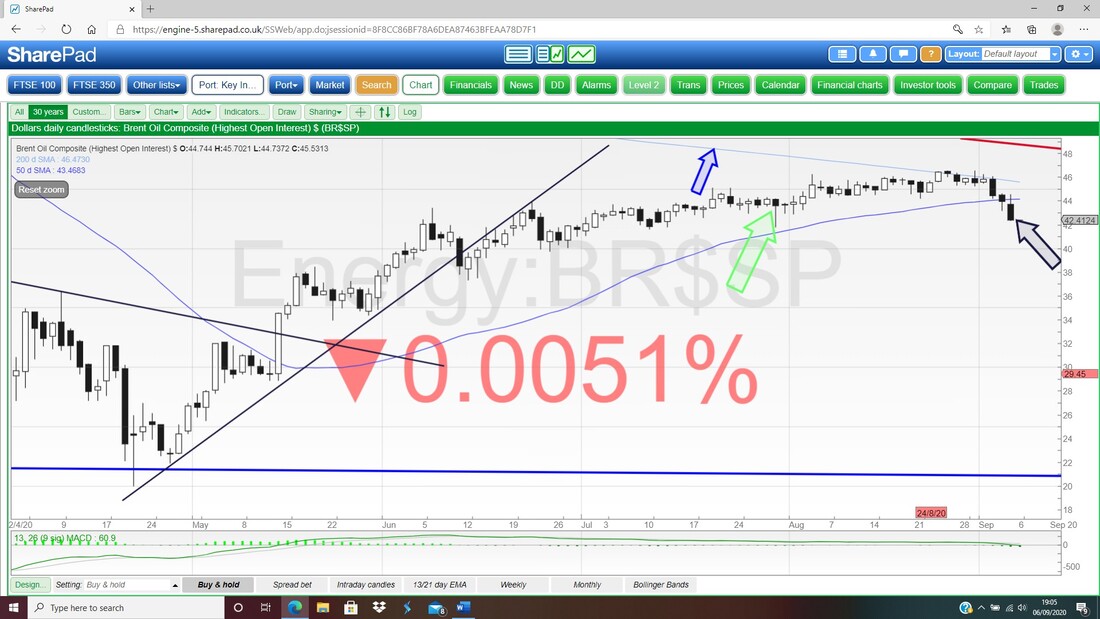
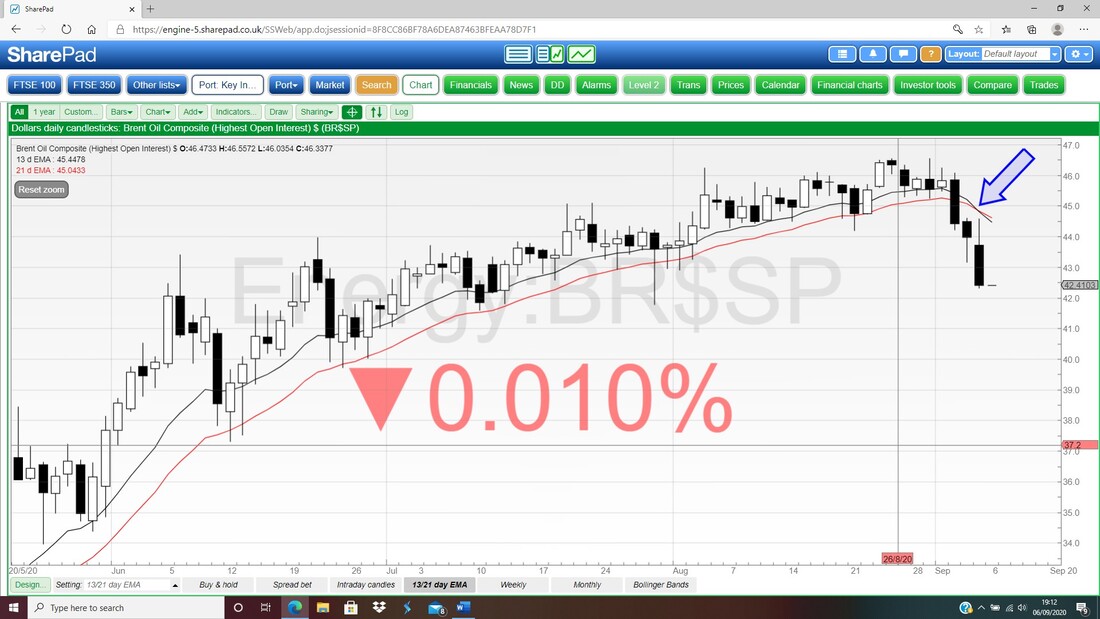
My sense of foreboding has a bit more substance from this Chart !! Next up we have the Daily Candles for Brent Oil Comp but what I am showing here is a Bear Cross where my Blue Arrow is between the 13 and 21 Day EMAs and this is highly predictive of weeks of downside ahead. If Oil falls, then expect the FTSE100 and other Indexes to suffer.
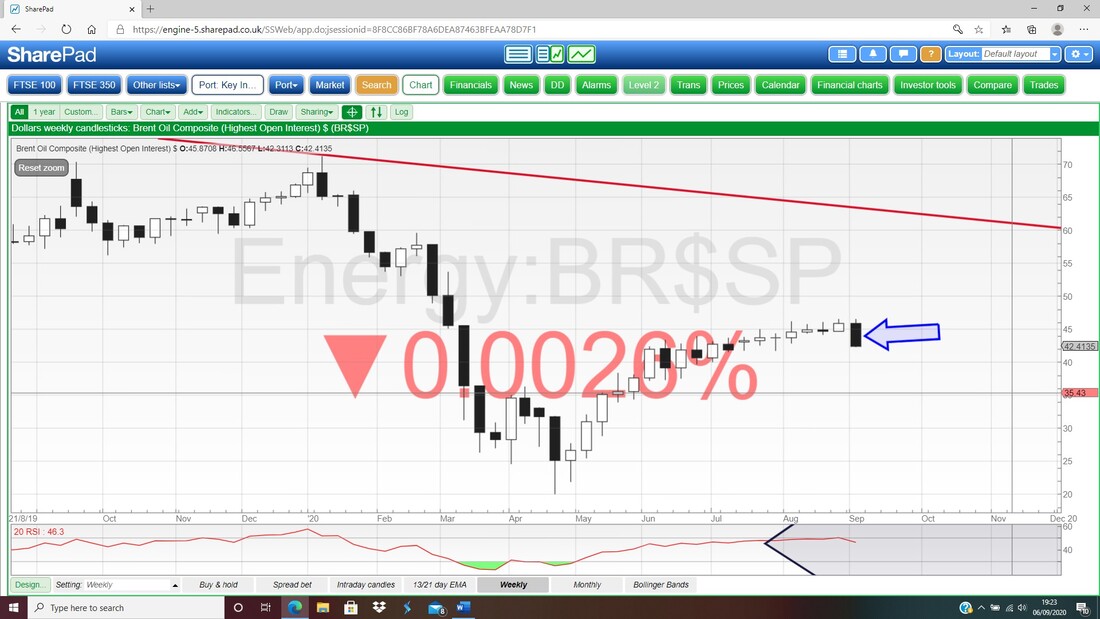
Next is the Weekly Candles for Brent Oil Comp and my Blue Arrow is pointing to a Big Down Candle from last week. In isolation this is not hugely Bearish but in light of the previous Charts it sort of helps paint an overall picture of weakness.
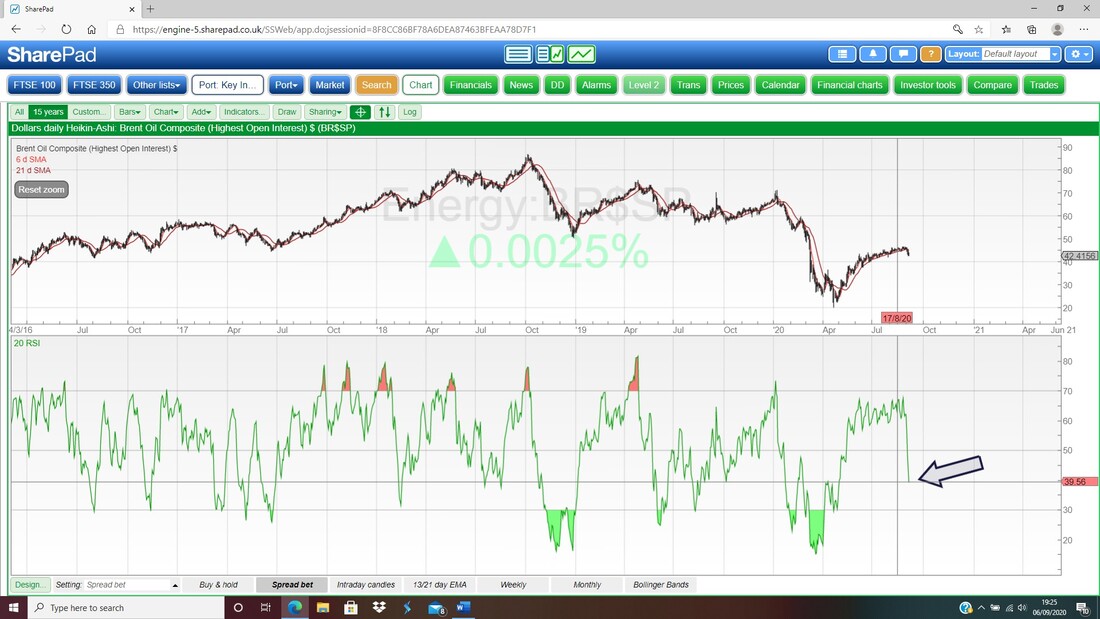
In the bottom window below we have the Daily RSI for Brent Oil Comp and my Black Arrow is pointing to a Reading of RSI 39 which leaves plenty of room to fall more if it so wishes. Note the recent Lows here were as far down as RSI 15 but to be fair those were pretty unusual.
FTSE100
As I keep mentioning, I have a Short on the FTSE100 and I am expecting to Short it more in coming days. First up we have the Weekly Candles and my Blue Arrow is pointing to a Big Down Candle from last week which is obviously Bearish. It seems to me that this Chart is turning down…….. 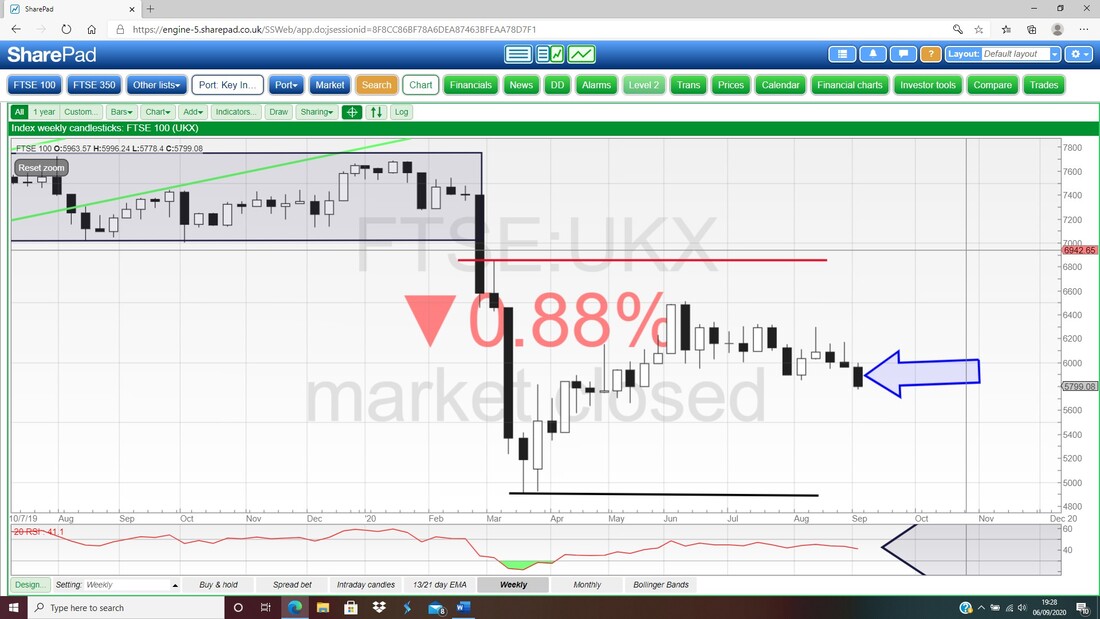
Next we have the Daily Candles for the FTSE100 but I am more interested in the 13 and 21 Day EMAs here which are in Bear Mode after a Bear Cross back where my Black Arrow is.
This is my favourite Indicator and I am driven to a large extent by whether or not this is in Bull or Bear Mode. 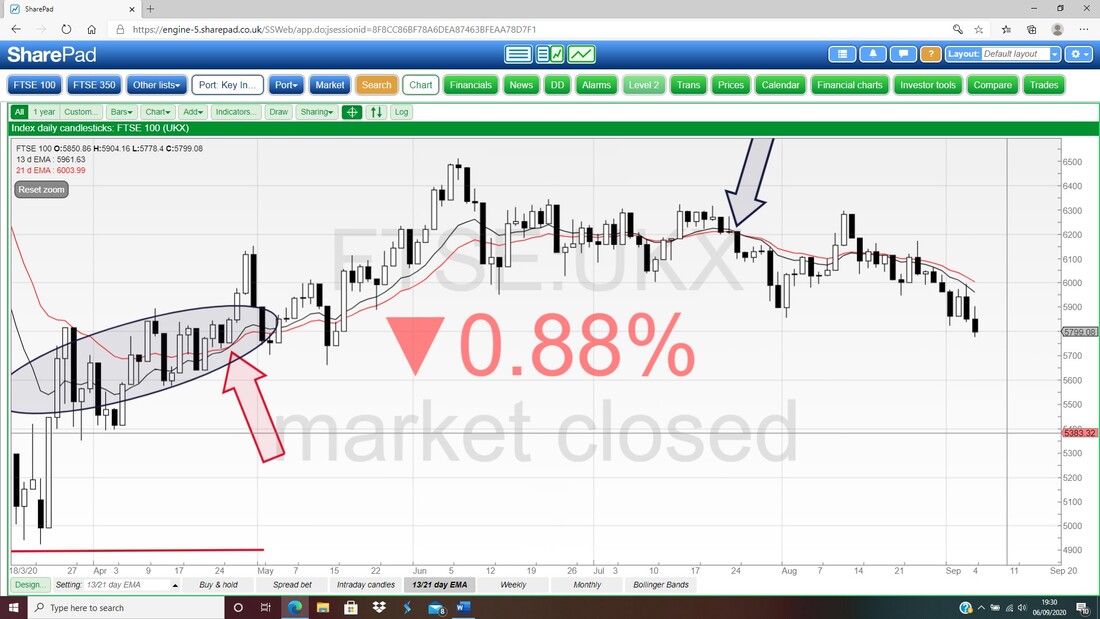
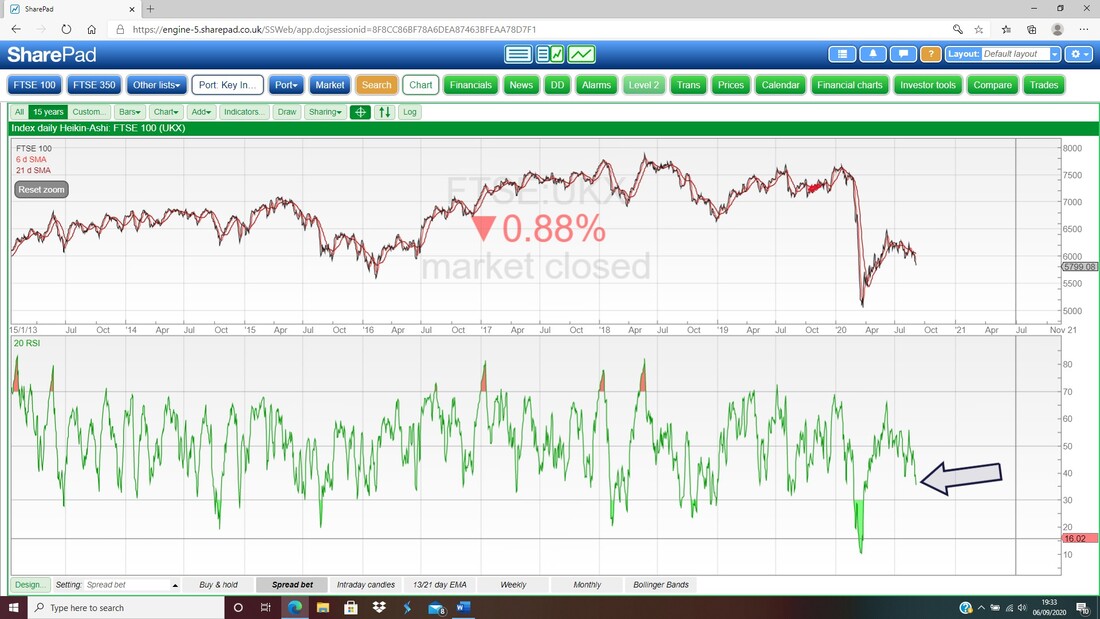
Next in the bottom window is the RSI for the FTSE100 Daily and my Black Arrow is pointing to a Reading of RSI 36 which is getting low but can go a lot lower. RSI 30 is usually seen as ‘Oversold’ but note how it went as low as RSI 10 back in March !!
Finally tonight we have the Daily Candles for the FTSE100 with the Bollinger Bands above and below. My Blue Arrow is pointing to a Down Candle from Friday but note it is down near the Bottom Bollinger Band and I would expect an attempt to move up from here. If it does bounce then the Midpoint at about 5960 could be Resistance.
To the downside, if we keep falling next week, then there is Support at 5661, 5600, 5400 and especially at 4898 which was the Low in March. If 4898 fails then we really are in the poo !! Anyway, I hope I haven’t scared you all too much, and remember to keep your wits about you and don’t do anything rash and stupid in coming days – we could be in for some fun. Good Luck, cheers, WD. 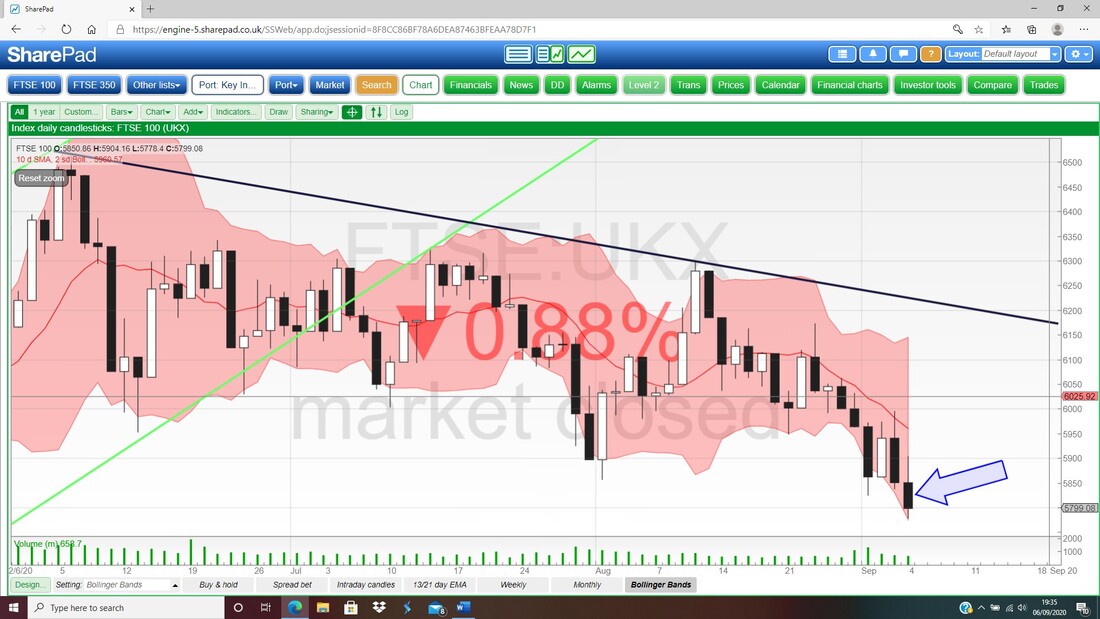
0 Comments
Leave a Reply. |

Stocks & Markets WheelieBlogsThese tend to be more Markets and Stocks related and timely - the Blog Page on the Main WheelieDealer Website has the 'Educational' stuff (well that's the theory anyway !!). Archives
October 2021
Categories
All
|
