

|
stocks & Markets blog |
|
THIS IS NOT A TIP OR RECOMMENDATION. I AM NOT A TIPSTER. PLEASE DO YOUR OWN RESEARCH. PLEASE READ THE DISCLAIMER ON THE HOME PAGE OF MY WEBSITE. IF YOU COPY MY TRADES, YOU WILL PROBABLY LOSE MONEY. I HAVE A LARGE PORTFOLIO AND I USE DIVERSIFICATION TO SPREAD RISK ALONG WITH TRICKS LIKE HEDGING AND OCCASIONALLY BY THE USE OF STOPLOSSES - IF YOU BUY ANY STOCK YOU REALLY SHOULD FOCUS ON HOW IT FITS IN WITH THE REST OF YOUR PORTFOLIO AND KEEP RISK MANAGEMENT AT THE FOREFRONT OF EVERYTHING YOU DO. BE AWARE THAT ALL INVESTORS/TRADERS GET THINGS WRONG AND MANY STOCK SELECTIONS WILL WORK OUT BADLY. ALSO BEAR IN MIND THAT WE HUMANS HAVE A PSYCHOLOGICAL BIAS WHERE WE EASILY GIVE A POSITIVE VIEW TO SOMETHING WHERE LOTS OF INFORMATION IS AVAILABLE.
If you have not read Part 1 yet you can find it here: https://wheeliedealer2.weebly.com/stocks--markets-blog/bango-bgo-buy-rationale-part-1-of-2 Recent Trading As is always the way, I wrote the text regarding the ‘Final Results’ a few days ago, thinking that would complete this section. Then of course, lo and behold, out comes another ‘Trading Update’ on 14th July 2020 which you can read here: https://polaris.brighterir.com/public/bango_plc/news/rns/story/w68l09r This is fairly short as you would expect really, but it’s pretty decent. The stand outs for me are:
‘Record revenue growth ahead of expectations, with EUS expected to be £2B in FY20.’
Revenue Record Revenue growth of more than 50% to £4.8M (vs 1H 2019 Payments revenue of £3.18M) Adjusted EBITDA Adjusted EBITDA for 1H 2020 is expected to exceed the full year 2019 value of £0.45M (which included Audiens). Cash The Bango Platform generated cash in 1H 2020. Cash on 30 June 2020 was £4.2M. This accounts for NHN deal related and associated internal costs and the Audiens earnout payment (from January 2020) totaling approximately £1.8M. End User Spend End User Spend (EUS) grew strongly to more than £740M. This continues the exponential growth trend in EUS through the Bango Platform and, as the full benefits of the customer wins and route activations (for example Softbank and Amazon.co.jp) won during 1H2020 are seen, we expect to see a strong 2H 2020 to meet full year forecasts.’ It’s all good stuff really with EUS (End User Spend) growing well, Cash being generated and the Bango Marketplace which does the Data Analytics and Marketing stuff seems to be getting traction. Before that, the most recent Update from Bango on their trading was contained in the ‘Final Results’ RNS from the 17th March 2020, which you can read here: https://polaris.brighterir.com/public/bango_plc/news/rns/story/x432low Looking at the 2019 Full Year performance to 31st December 2019, this quote stands out: ‘End User Spend (EUS) increased to £1.1Bn, continuing the five-year trend of doubling EUS every year (2018: £0.56Bn).’ As I mentioned in Part 1, the Business Model is essentially that Bango takes a tiny percentage of the End User Spend and with this doubling every year, then it is easy to see how continuation of such a growth rate (ok, that is a big ask !!) would soon see the End User Spend up around £8bn or so and consequently the Revenue to Bango would rise hugely (later in the ‘Valuation’ section I look into this aspect more). I don’t want to teach Readers how to suck Cadbury’s Crème Eggs, but after 1 year EUS could be £2.2bn, after another year that would be £4.4bn and after another year that hits £8.8bn. So just 3 years would see a big ramp up if this growth rate can continue. In support of this, it is worth appreciating that Bango has achieved the fast growth of recent years without all the benefits of the Data Analysis and Marketing Information capabilities they now have – that could help sustain the fast growth. ‘Management expects continued exponential EUS growth driven by success from existing customers, new opportunities from 5G and the new market opportunities that 2020 will bring.’ The paragraph just above comes from the ‘Outlook’ section on the RNS and plays to the fast growth expected in End User Spend. ‘Group revenue increased 41% to £9.31m (2018: £6.62m) Payment and data monetization revenue grew to £7.16m and £2.15m respectively (2018: £5.25m and £1.37m.’ These numbers speak for themselves. It is great to see the data monetization revenue growing rapidly but that might be skewed a bit by the Audiens acquisition. ‘Group admin costs were £7.45m (2018: £6.69m) following the decision to increase investment in the data monetization business.’ The theory is that the Cost Base should stay relatively static going forwards as the End User Spend and hence the Revenues ramp up and this then means a lot of the Revenue increase falls to the Bottom Line as Profit. This will be something to keep a close eye on as we don’t want to see the Costs rising too fast in coming years. This concept is defined as Operational Gearing. ‘Increasing 5G deployments in 2020 will deliver entirely new services to customers over mobile networks. The ultra-low latency, high speed 5G connectivity is already driving online game streaming companies into the Bango circle. The first is Hatch, the monthly subscription based 5G games streaming platform, which launched carrier billing payment services in the USA through Bango in March 2020.’ That text just above comes from the other bit marked ‘Outlook’ further down the RNS. This plays to my sense that as Mobile tech gets faster and able to handle far larger volumes of data, this helps Bango in the monetization of what it offers via its Payments Platform. As we see more 5G Networks around the world, this suits Bango a treat (and I even hear talk of 6G but that is some way off !!). Further down in the second ‘Outlook’ section the narrative talks at length about the Bango Marketplace business and how they expect this to become increasingly important to the Company. SharePad ‘Phil Oakley’ Charts I have looked through the excellent ‘Phil Oakley’ Charts on SharePad and picked out the following ones for particular attention and comment. Many of them are not particularly relevant because of the stage of development of the Company. These Charts are probably more useful when you have well established Companies with years of Revenue, Profit and Dividends etc. and many of them are more meaningful. Having said that, even with a Company at the stage of Bango it helps highlight anomalies and you can see this regarding my comments about Blackberry further down. I captured these Screen Images on Thursday 16th July 2020. The thing that clearly stands out on the Chart below is that the Turnover (Revenue) was reducing from peaking in 2010 and fell until the low point in 2015. It would of course be useful to an extent to understand what happened here but because it is from quite a few years ago now I am not obsessed about figuring it out. However, I used the RNS Archive in SharePad to go back to some Trading Updates from 2010 to 2013 and I suspect it is because Bango used to do a lot of business through the Blackberry Mobile devices from RIM (Research in Motion) which of course were all the rage, in the business world especially, many years back. The demise of RIM probably explains the fall off in Revenue and clearly in recent years the Revenue has been growing nicely. 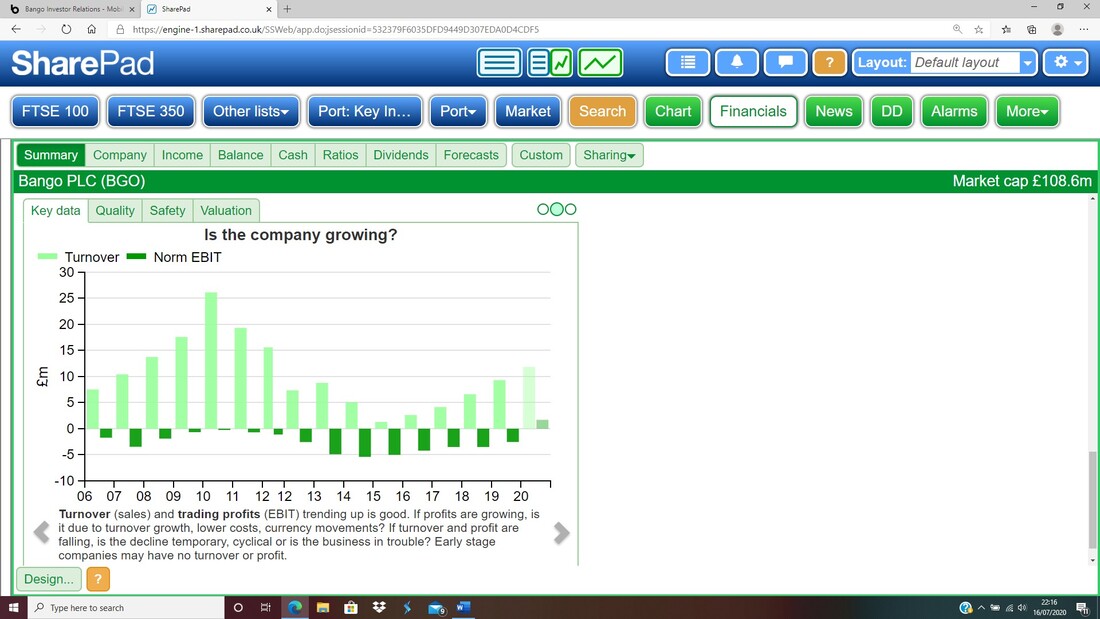
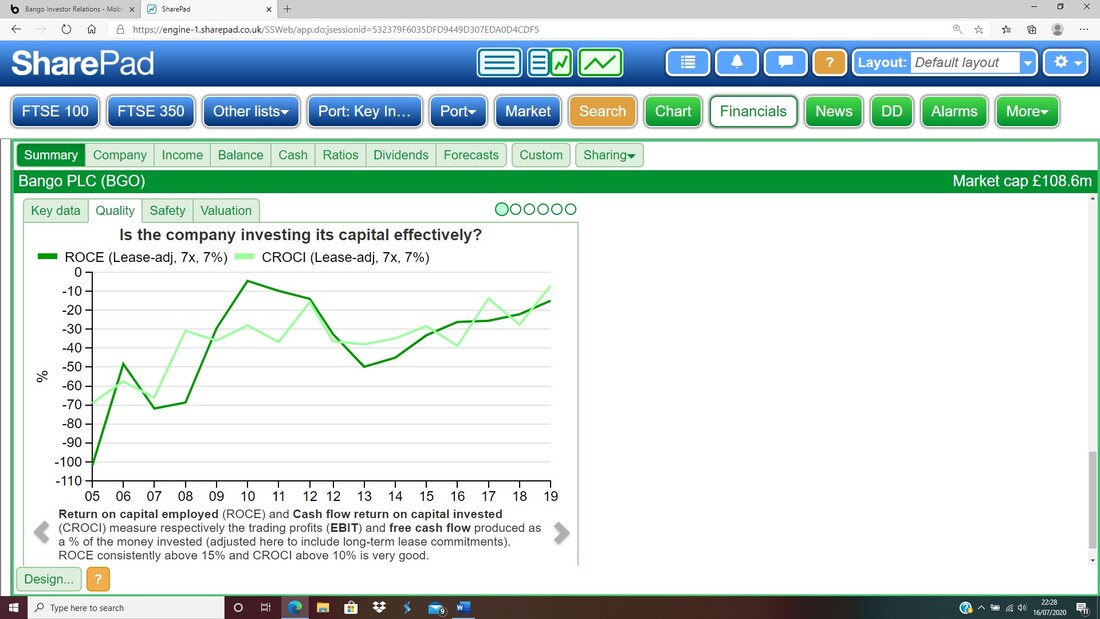
On the next chart, we need to realise that the numbers are still negative, but since 2013 (come on, that is 7 years ago !!), the trend is nicely up which suggests that Bango is exploiting its Capital more effectively as the years go by.
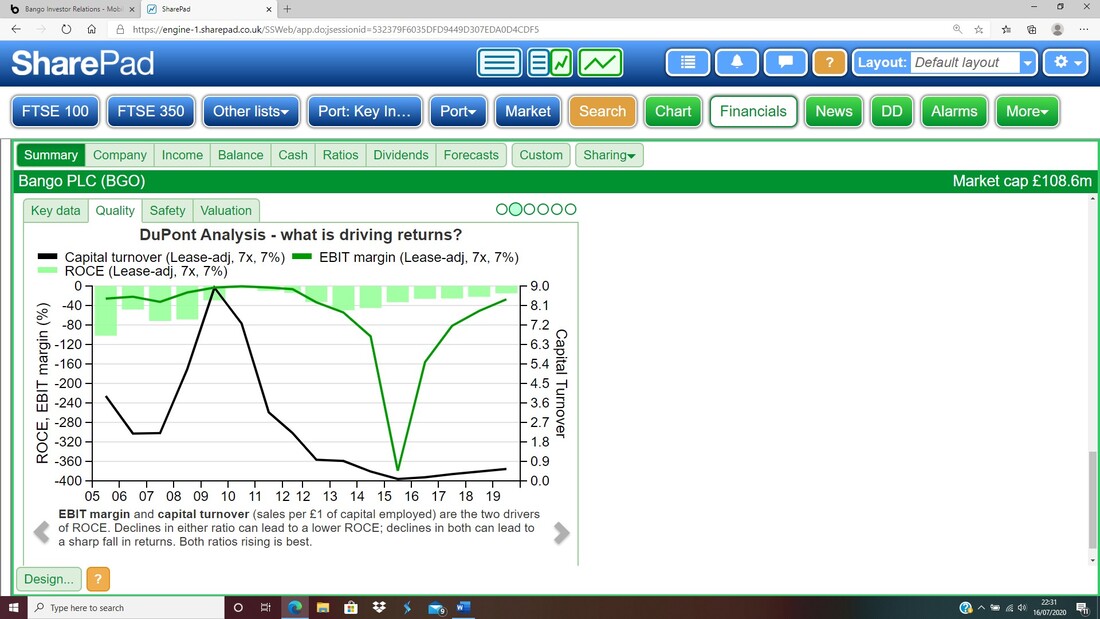
I have chucked in the next Chart because Readers might like it, but to be honest I am not really clear on what it means !! Again the numbers are negative.
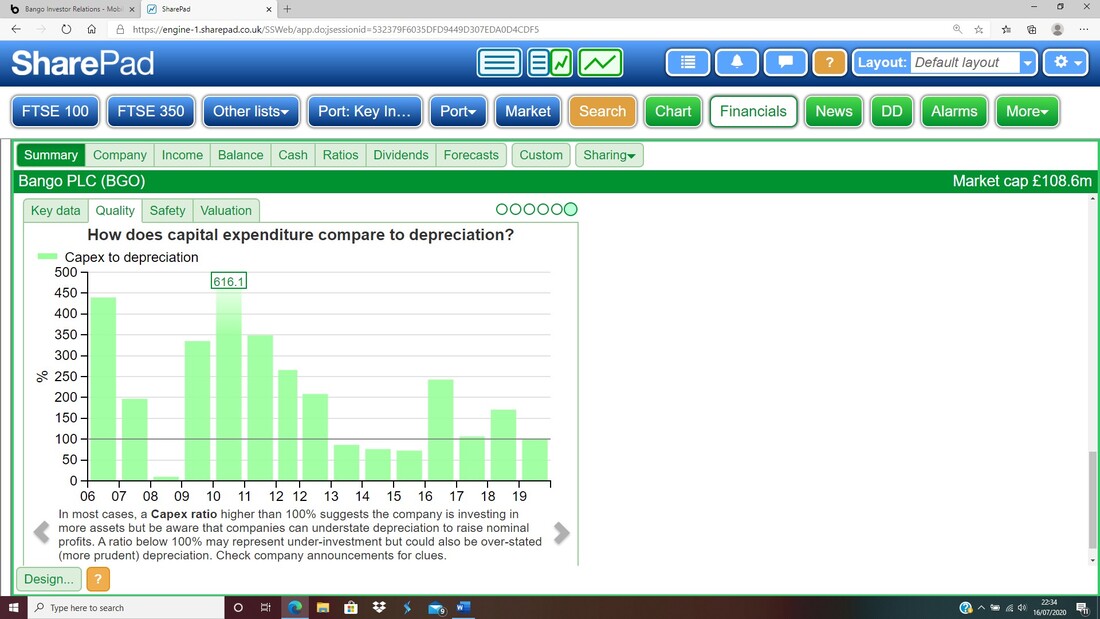
The next Chart I have also chucked in because Readers might find it useful.
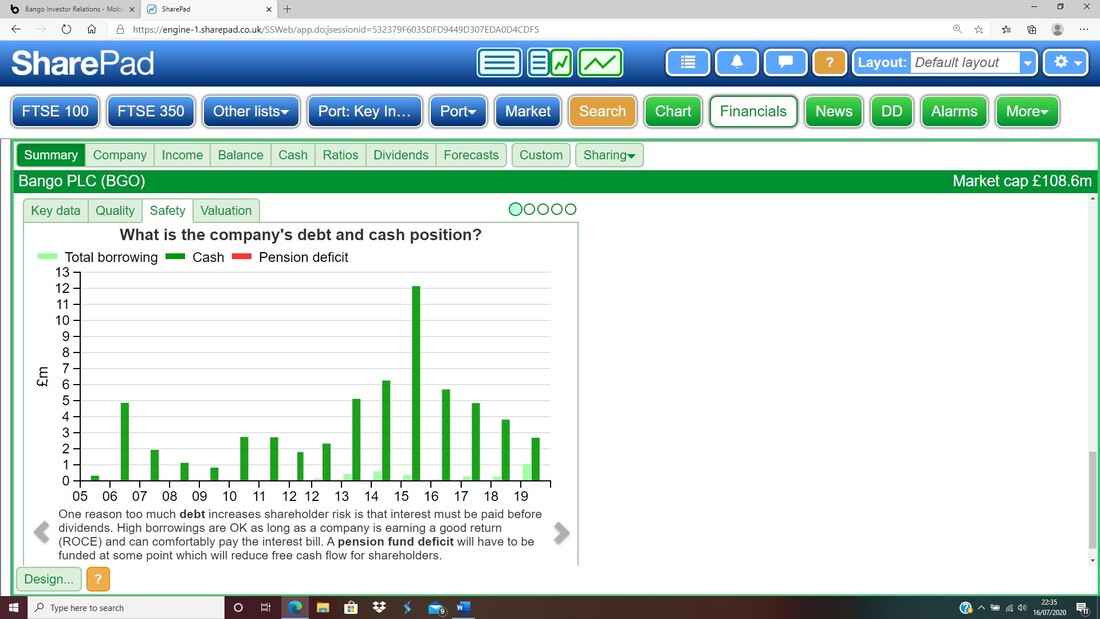
The next Chart shows that Cash has been coming down in recent years, but this is no surprise and reflects Investment in the Bango Payments Platform etc. and I think there were also some small acquisitions.
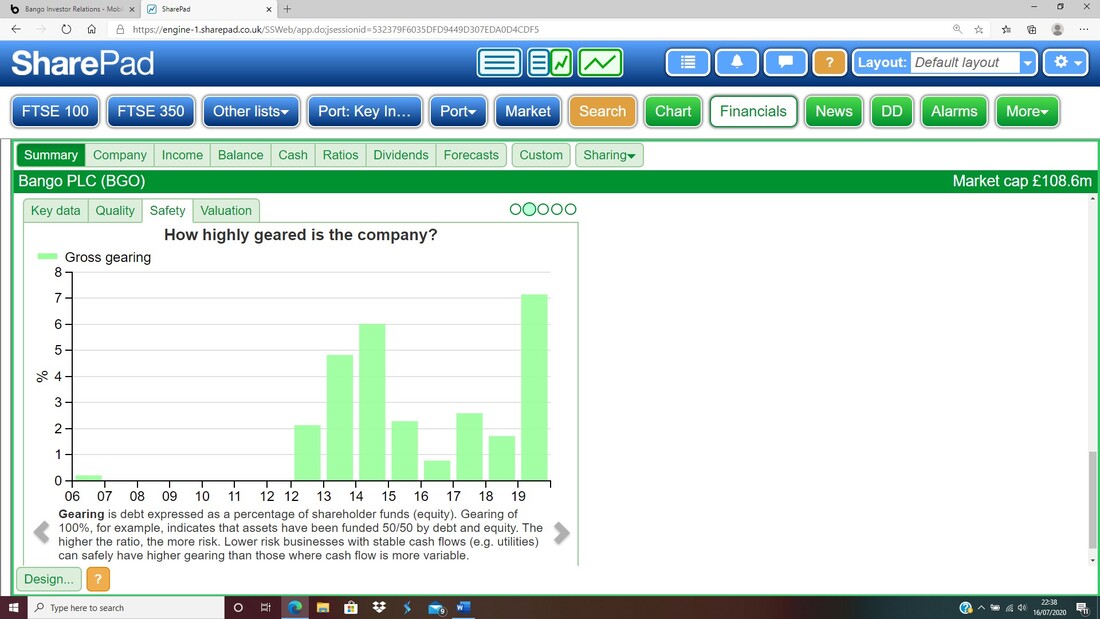
On the next Chart it is evident that Gearing (in effect the proportion of Debt) is rising but it doesn’t look extreme in terms of the % of Equity at around 7%.
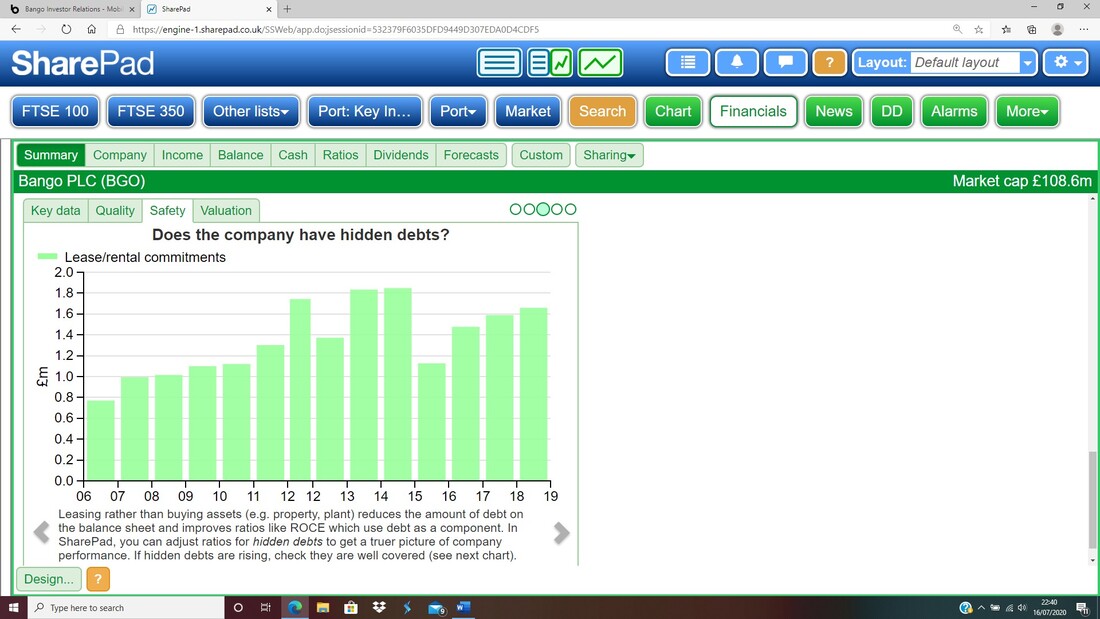
The Chart below shows Bango has some Lease and Rental commitments although they don’t seem massive. They have been rising though and that is something to watch in future.
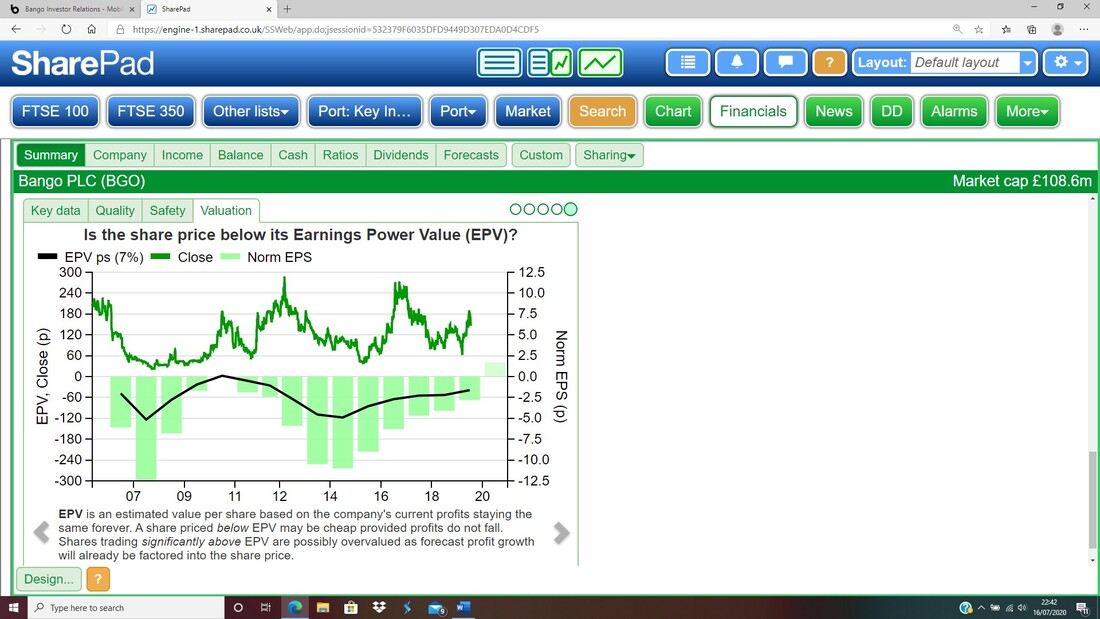
Most of the ‘Valuation’ Charts for Bango are pretty irrelevant but this one might be of interest to Readers so I have lobbed it in.
Cash Generation
The Chart below is another from the ‘Phil Oakley’ set on SharePad. It is no surprise that Bango is not yet generating Cash as we know that it is all about ramping up that End User Spend and consequently increasing Revenue and EBITDA (EBITDA is a rough proxy for Cash Generation). On top of this we ideally will see more Revenue and following this some Profit and Cash Generation from the Bango Marketplace and the Data Analysis and Audience Targeting side of the business. Looking at the Chart you should be able to see that Free Cash Flow was particularly bad in 2016 and Readers might want to look into this in more detail. From a quick look at the Final Results for that period, I can see that a chunk of Cash went on Investment for the Bango Payments Platform (this is a common theme across the years as they have increased its capacity to handle increasing End User Spend. In fact, one year I looked at said they only had £1bn of capacity and now they are up at £25bn !!) and there are also some write-offs of Intangible Assets from what I can see (that is slightly confusing though because I would expect such a write-down to be Non-Cash). Such a write-down might have resulted from the demise of Blackberry. 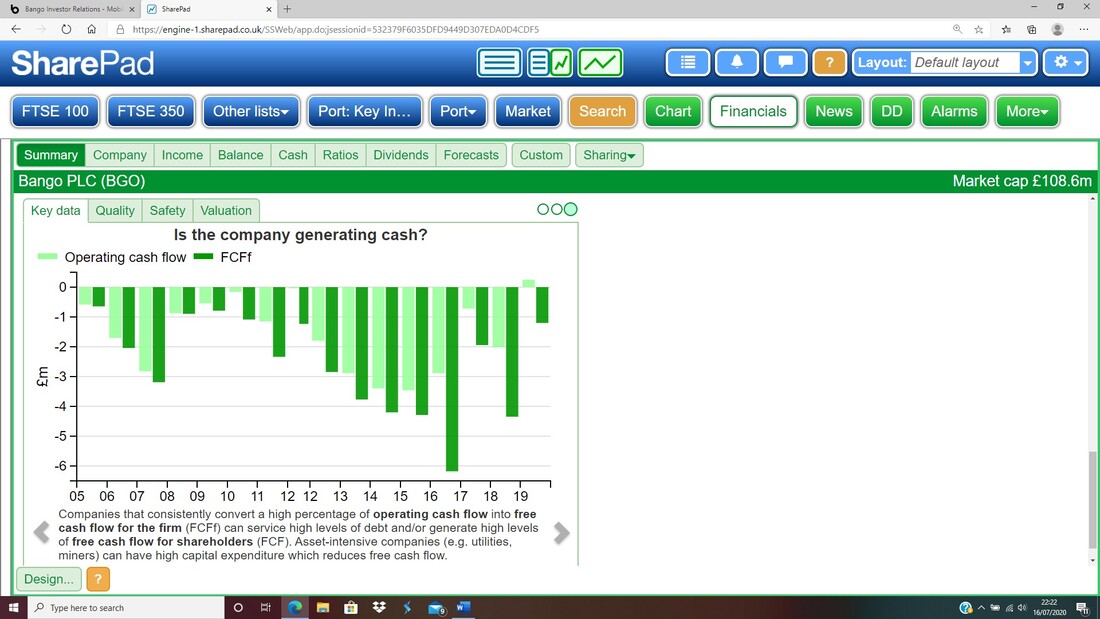
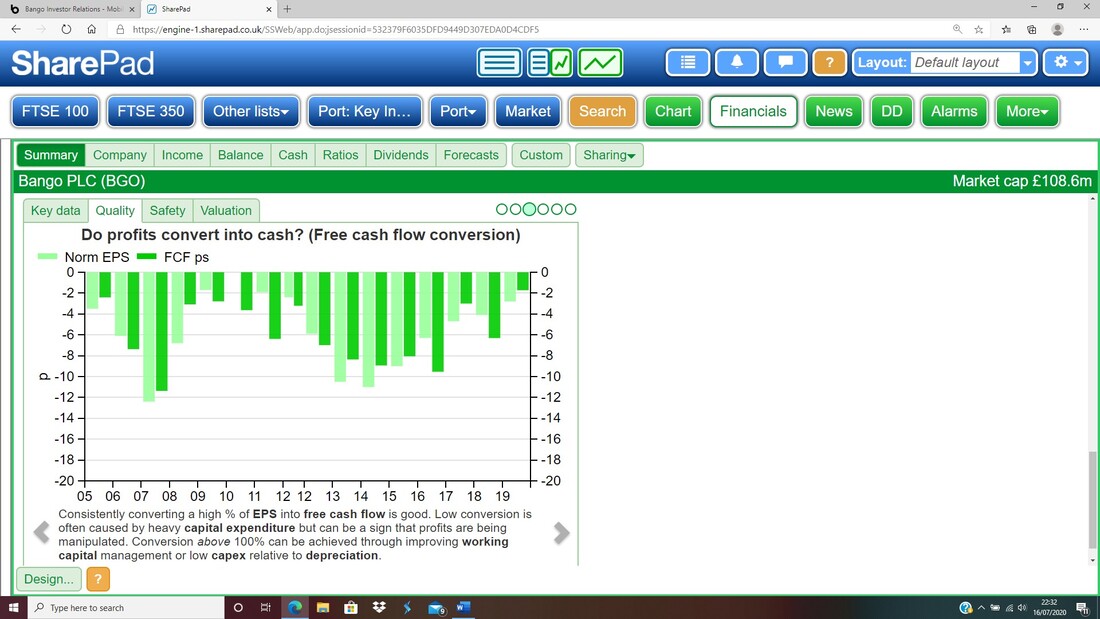
The next Chart is also from the ‘Phil Oakley’ selection on SharePad but because Bango is still on the verge of Profitability, I am not sure it means much !!
Dividend Policy
At the moment Bango is in the growth phase and any spare Cash is being ploughed into R&D and Sales & Marketing efforts. There may come a time some years down the line where they pay a Dividend but at present focusing on growth seems the best way to use limited resources. Valuation This has not been an easy thing to address and I have put a lot of store in the view from Simon Thompson in ‘Investors Chronicle’ where he has stated several times that he sees Bango making “£10m of Cash Profits within a few years”….. OK, that is pretty loose, but Simon is no mug and it doesn’t seem a crazy claim when you consider that the Payments Platform is sized to £25bn of End User Spend with limited Investment needed to increase capacity from the current level in the region of £1bn (and expected to be £2bn by the end of FY 2020). Simply basing a Valuation on Simon’s loose forecast, at a Share Price of 144p at the time of scribbling this text (that is the Mid Price so the Buy Price is likely to be a bit higher), the Market Cap is £107.1m which is roughly 11 times Simon’s “10m of Cash Profits”, but we need to consider that this could be as late as 2023 or so. Further down this section I will try to put some rigour around these raw numbers but there are a few things to consider that would make a Valuation of 11 times Cash Profit pretty decent. Firstly, with the gearing that the Profits have to the increase in Revenue resulting from more End User Spend, this figure of £10m Cash Profit is not too crazy – so it seems achievable. Secondly, it seems very possible to me that Bango can actually grow faster than the forecasts imply. The Company seems to be getting itself in a virtuous circle where as they add more Partners and App Sellers and Mobile Operators, as well as the boost from the Marketing side with Bango Marketplace, the growth could really pick up fast. As I mentioned earlier in Part 1, I think to an extent the recent improvements in speed and processing power of devices to access Digital stuff is really meaning that Bango’s capabilities are now having their time in the sunshine. And thirdly, it is certainly the case that fast-growing Tech Companies are getting assigned very high ratings in the current dash for anything Tech related. Payments businesses are particularly sought after and it wouldn’t be crazy to think that Bango could be trading on 40 times the Cash Profits in a few years – that would increase the Share Price by 4 times !! Progressive Equity Research Fortunately on the Bango ‘Investors’ page on their Website, there are loads of Progressive Equity Research Analyst Reports and you can read the latest one here: https://wp-bangoinvestor-2020.s3.eu-west-2.amazonaws.com/media/2020/07/14100307/BGO_20200714-Record-revenue-growth-momentum-strong.pdf The Table below comes from that Analyst Note and it is very useful to help give us a steer on the likely Earnings and the Forecast P/E etc. If you look at the column marked ‘2020E’ (the ‘E’ means it is Estimated rather than Actual reported numbers that have already happened), then you should see the ‘Fully adj EPS’ is 1.0. At the current Price of 144p, then this gives a Forward P/E Ratio of 144 (144p divided by 1p of Earnings), which is obviously very high but remember this is all about the growth. There are of course loads of ways of trying to predict the likely future Earnings in coming years, but as an extremely simple starting attempt, if we were to see a repeat of the growth from 2019 to 2020 in EPS, then we would see 4.9p of EPS in 2021. This might be fanciful and of course we need to dig deeper into the Numbers to try to ascertain how realistic this is. Anyway, assuming we do hit 4.9p of EPS in 2021, then at the current Share Price of 144p, that would give a Forward P/E for next year (remember we are already in 2020) of 29.4 (144p divided by 4.9p). This shows quite clearly how fast the P/E Rating can fall if we see fast growth in the EPS which should happen as the operational gearing effect kicks in. Note how the fast growth in the EPS from 2019 to 2020 is derived from the doubling of the End User Spend (the ‘EUS (Non-GAAP)’ row right at the top of the Table) and with Bango’s record of having doubled EUS for the last 4 years, if that happens again from 2020 to 2021 then we will see the EPS utterly shoot up I suspect – so my very simple and lazy assumption of 4.9p of EPS could be far too low. 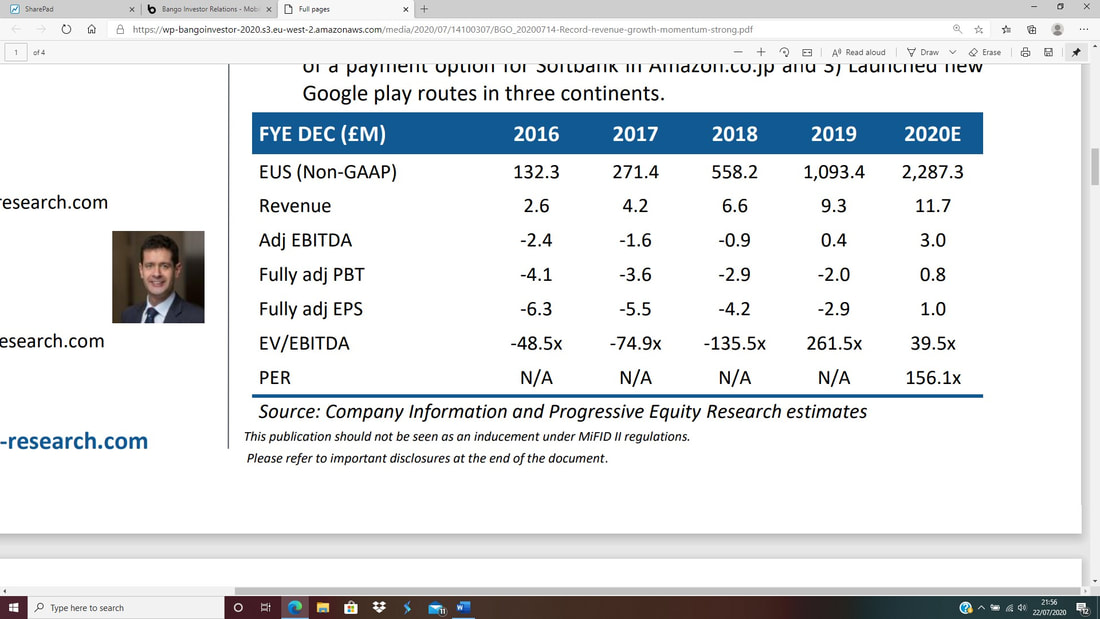
SharePad Forecasts
Another route we have to go on is the Consensus Forecast numbers that appear on SharePad. The Screenshot below contains the limited information we have on Bango and from this you should be able to see a Forecast ‘EPS (p)’ figure for 2020 of 1.7p. This is clearly a lot higher than the Progressive Equity Research prediction, and at the current Share Price of 144p that gives a Forward P/E Ratio of 84.7 (144p divided by 1.7p). 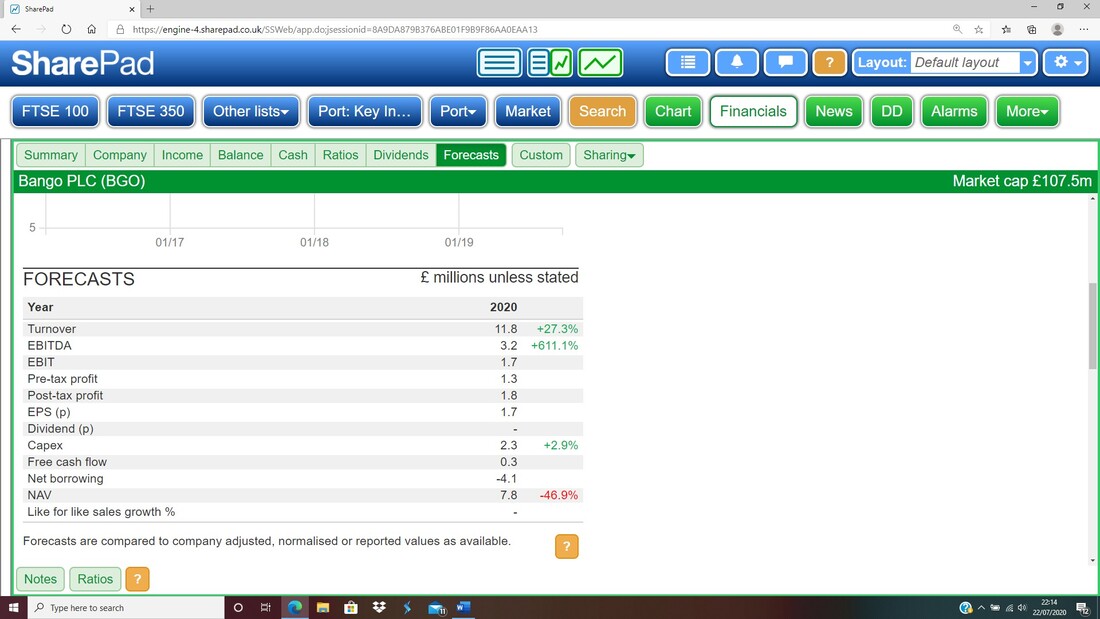
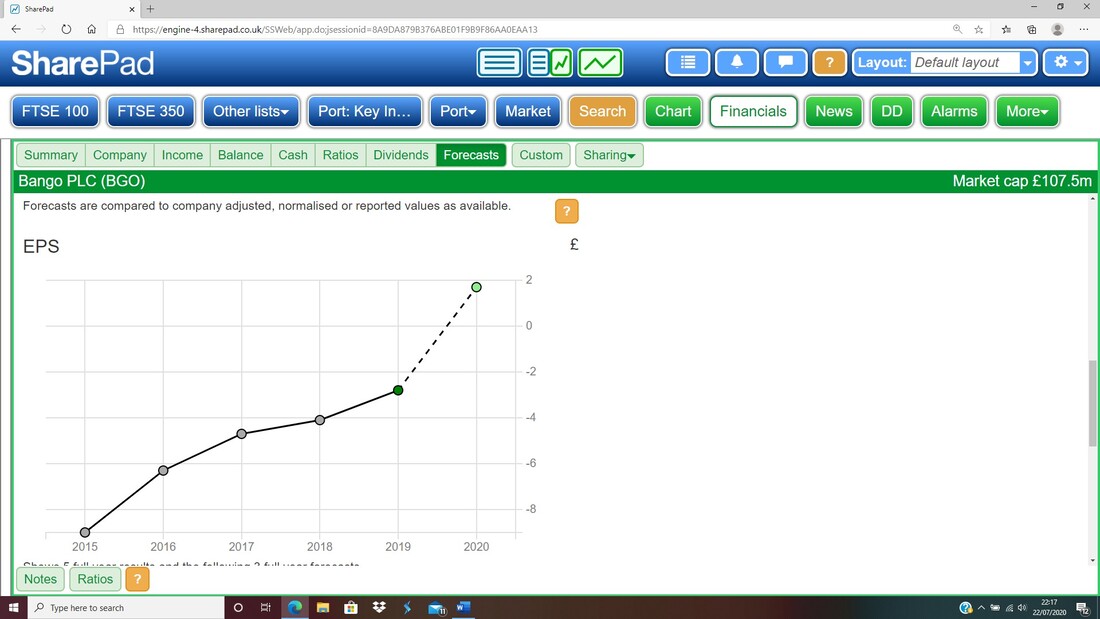
The next Screen comes from SharePad also and this gives us another possible but very simplistic and error-prone method of forecasting. What we can do very easily is to look at the slant of the graph line and merely by extrapolating that trend, we can get a very loose EPS Forecast for 2021 and further out (obviously the further out we go the more inaccurate we will be). On this basis, as a rough guesstimate I would say the graph suggests EPS of 4p is possible for 2021 and again on the current Share Price of 144p this would give a Forward P/E for 2021 of 36 (144p divided by 4p).
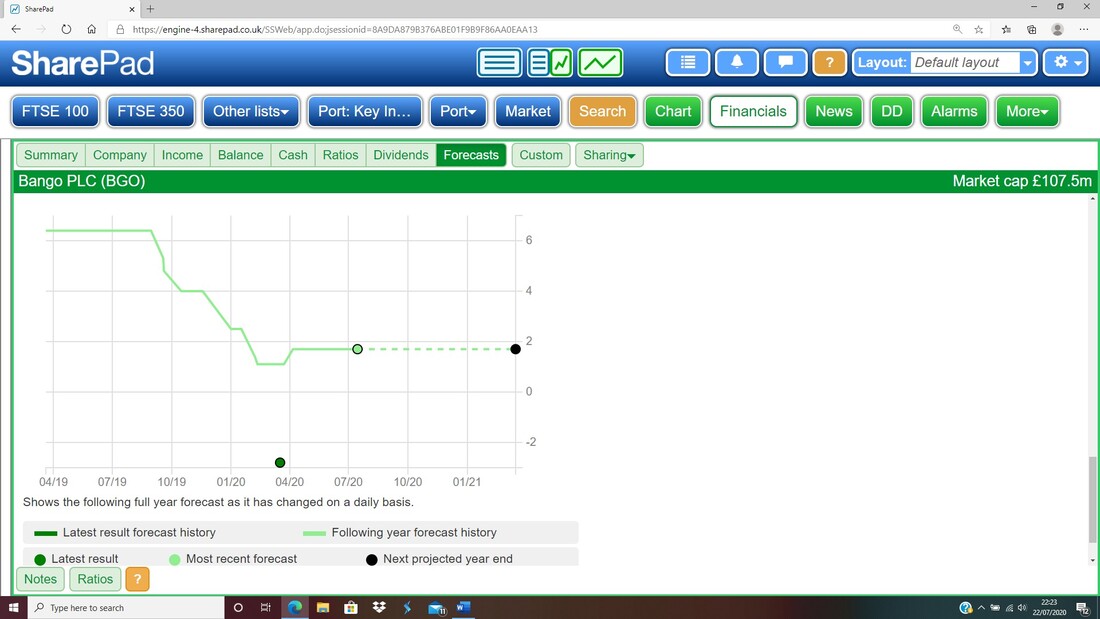
I have lobbed in the Chart below for your information – looks like the Forecasts have been lowered recently, but because Bango is a relatively small stock there are not many Analysts covering it.
Some very rough Modelling
I wanted to look at the Profit & Loss Account for Bango to try to do some very wobbly guesstimates on how the key elements such as Revenue (Turnover), Cost of Sales, Gross Profit etc. would grow over coming years by doing some extremely rough and unready guesswork. I used a sheet of scrap paper (recycled note !!) and did it loosely by hand with a pen and then I have knocked that into the Table which follows the P&L from SharePad. With the SharePad P&L I have zoomed in to just the top part so you can see it clearly, and to be honest for my purposes we don’t need the stuff below that. 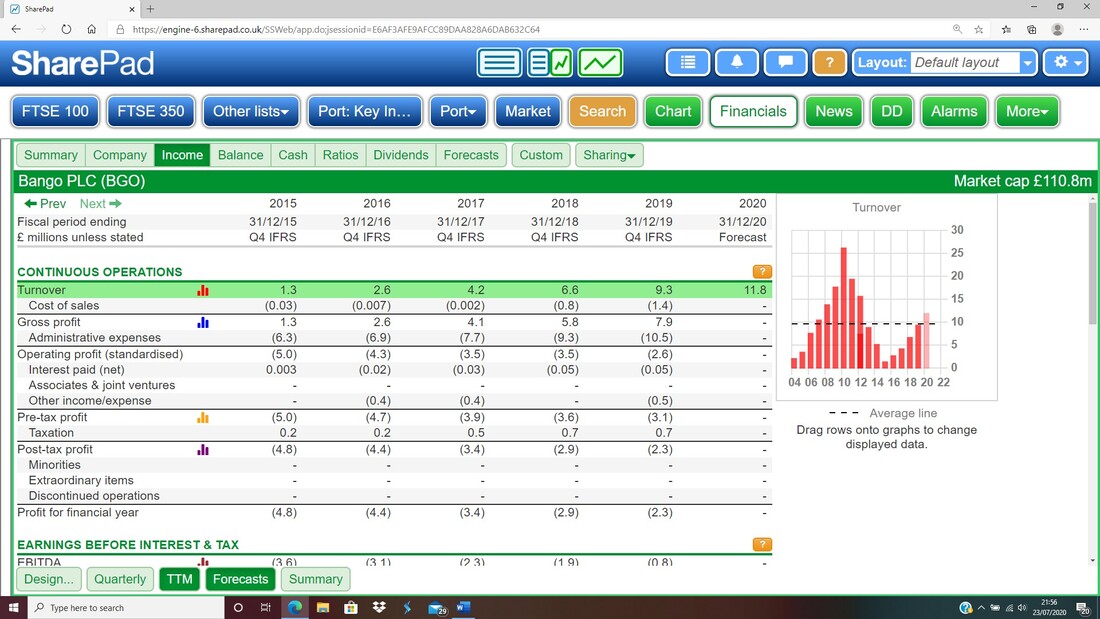
Note, on the P&L above from SharePad how you can highlight a Line of the Accounts and drag them to the right and it creates a Bar Chart of the data – I love that and it is an extremely useful feature.

On my Table above, please note the following:
I have actually found this quite an interesting thing to muck about with and it sort of helps in understanding how Bango might be able to grow and how many years need to pass by to hit the kind of “£10m of Cash Profits” number that Simon Thompson was talking about. As yet another rough & ready approximation, we can say that the Operating Profit figure at the bottom of my Table is not a million miles away from a guesstimate for EBITDA, and is in effect the Cash Profits that Simon Thompson is going on about. With that understanding, using my Model we can see that by 2023 we have not yet reached Simon Thompson’s £10m figure but it is likely if you added another Column for 2024, with similar kinds of assumptions, you could get to the magic £10m. But of course that is many years away really. However, as per my Bullet Points under the Table, I have been a bit conservative perhaps and it is extremely ‘back of a fag packet’. For example, if you were to make the Turnover figures a bit higher and if you were to lower the Costs a small bit, you would probably find that we hit £10m of Operating Profit by 2023 – which is not all that many years to wait for a Long-term Investor. My rough calculations (if you can dignify them with such a word !!) probably don’t really allow much, if anything, for growth from the Bango Marketplace Data Analysis kind of capability – so this could add upside. Let’s say my figures for Operating Profit for 2022 of £3.7m and for 2023 of £7.5m are about right and that they equate to ‘Cash Profits’. On that basis, on the Current Price of 144p and a Market Cap of £107.1m, then the Multiple for 2 years out (bear in mind the 2020 Financial Year ends on 31st December 2020 and we are only a few months away from that) is 29 times (£107.1m divided by £3.7m) and for 3 years out it would be 14.3 times (£107.1m divided by £7.5m). Targets I think the stuff I have written in the ‘Valuation’ section above has covered this in a fair bit of detail and from several angles, and because of the stage of development of Bango and the lack of Analyst Reports, we don’t really have lots to go on. For that reason I will not dwell on this section and will just keep it simple. I will fall back on Simon Thompson’s “£10m of Cash Profits in a few years” statement, and if we were to apply a Multiple of 20 to this rather than the current 11, then the Share Price would pretty much double to about 275p. To be conservative, a Target of 250p would make sense but if we take it a bit more to an extreme of things going very well (it is possible but at this stage impossible to know with any certainty), then a Multiple of 30 would give us a rough Target of 400p or so. As I have said, this is pure guesswork and all I can say for definite is that I like what Bango are up to and I am balancing the potential with the risks I perceive, and as a result I will not be buying loads at this stage and will keep my Position fairly small relative to some other Stocks I hold. However, I do intend to buy more than what I have at the moment and I am very much looking to the Long-term and on that basis I would certainly be hoping for as much as 400p in a few years. If the story gets better, then I might buy more as the months and years tick by. Technical Picture As before, the images I am showing here are all taken from SharePad and I captured them after the Close on Monday 27th July 2020. If you click on them, then they should get larger so you can see more detail. As is always ‘best practice’ with Charting Analysis, I am starting with the big picture and I will zoom in on the next few Charts. This first one goes back to 2005 so pretty much has all of Bango’s history and the key thing to note here is that it has been very much sideways in a wide Range over all those years – between about 20p at the lowest and 290p at the highest; and at the Closing Price of 144p today it is around the middle. The Blue Horizontal Line is where I bought my Spreadbet – I always mark the Price in such a way (I tend to show normal Shares with a Green Line). 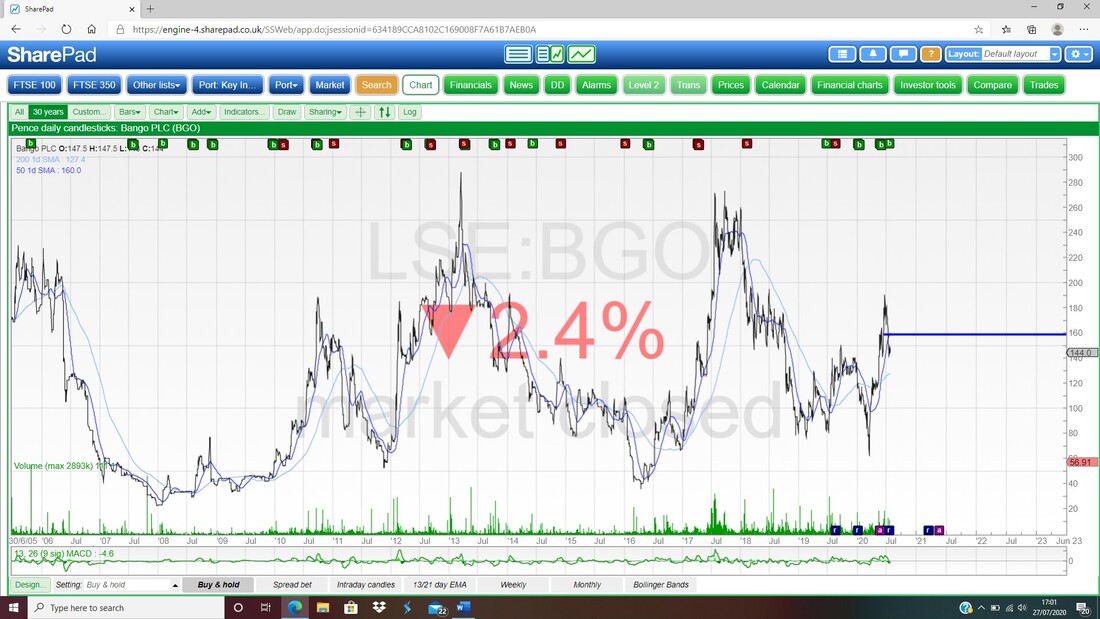
My next Chart goes back to November 2019 (there is no particular reason why I have gone back to this date !!) and shows the Daily Candlesticks, but I am more interested in the ‘Bear Cross’ where my Blue Arrow is between the Black 13 Day EMA Line (Exponential Moving Average) and the Red 21 Day EMA Line. These tend to be highly predictive and at the moment it is predicting weakness and until we get a ‘Bull Cross’ on these Lines (like what happened back in March 2020), that won’t change.
My small Red Ellipse is capturing a ‘Hammer Doji’ Candle from 21st July 2020 and this found Support Intraday at about 134p. My big Black Ellipse is highlighting a Zone of Support around 110p to 125p ish. 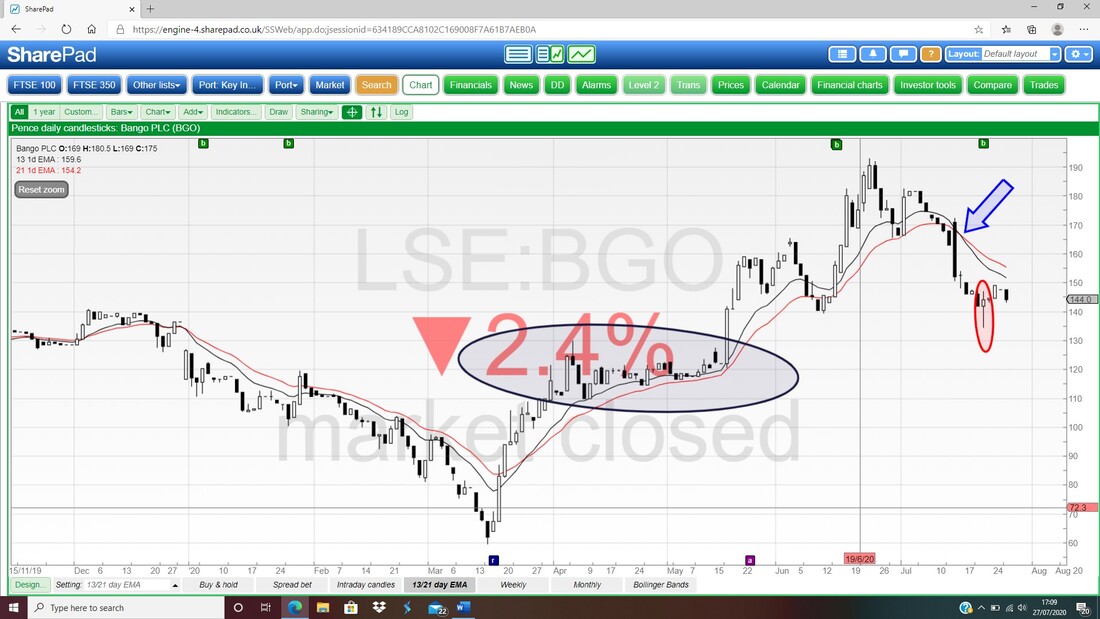
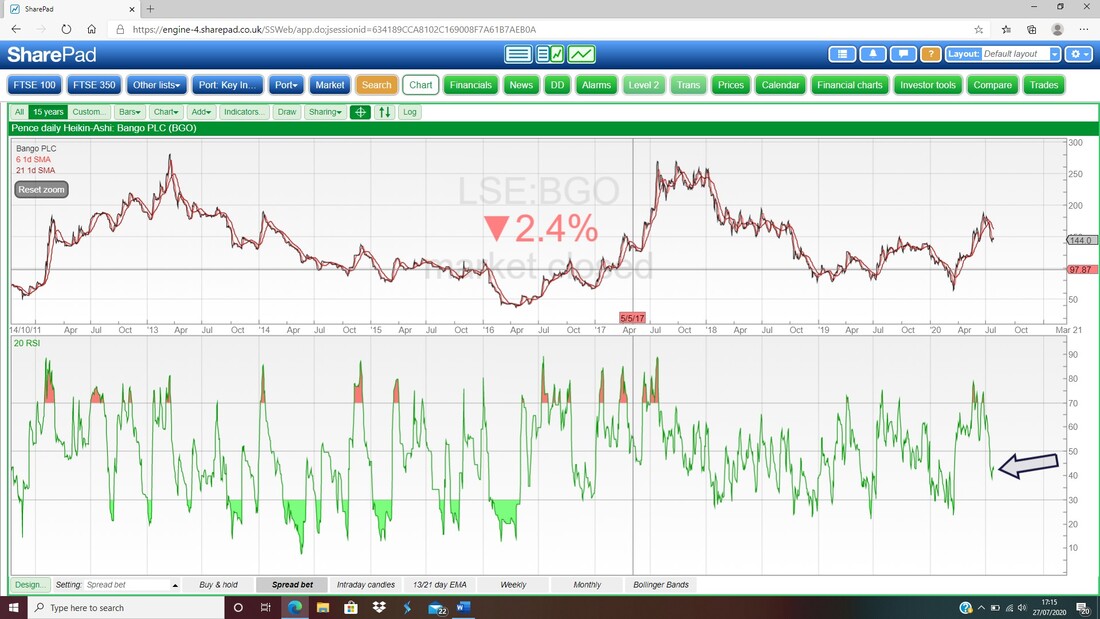
In the bottom window on the Screen below we have the Daily RSI Indicator (Relative Strength Index). On a Reading of RSI 42 where my Black Arrow is, this is getting low although many times it has been much lower than this on Bango. I get the impression that the Price is drifting a bit at the moment so there may be some very good opportunities to buy soon.
Conclusion
Phew, I was beginning to think I would never get this Buy Rationale blog finished because it is a bit of an epic. I am particularly attracted to Bango because of the Digital Payments theme and the Operational Gearing which kicks in as they sign up more Partners and Customers and increase the End User Spend. On top of this, there is the Marketing angle from the Bango Marketplace which has the potential to add nicely to the revenues and in time to the profitability. Probably the biggest concern I have is that Bango has been a bit patchy in the past but it strikes me that with recent advances in Network speed and processing power etc., the time has come for Bango’s offerings and this is enhanced by the proliferation of mobile computing and online shopping. Indeed, it appears that the onset of 5G Mobile could help Bango maximise its opportunities. To be fair to Bango, my perception of a patchy past might stem from the demise of Crackberry. It’s a tough one to value though and this is especially the case because of the lack of Broker coverage. I have had a go at it and the write ups by Simon Thompson have helped a lot, and I am sure they will continue to do so as the story develops and he writes about them more. Like all Stocks it is not without risk and for that reason I will not be buying huge amounts at this stage – I would like to increase my position and will probably do so in time; and as more information arrives from Trading Updates and Results and suchlike, it should get clearer what Bango can achieve on the financials side of things. I hope this blog helps Readers understand the Bango business and the potential and risks, and it has certainly been extremely useful for me to go through the structured exercise of creating this tome. Cheers, WD.
0 Comments
Leave a Reply. |

Stocks & Markets WheelieBlogsThese tend to be more Markets and Stocks related and timely - the Blog Page on the Main WheelieDealer Website has the 'Educational' stuff (well that's the theory anyway !!). Archives
October 2021
Categories
All
|
