

|
stocks & Markets blog |
|
Well, the big question at the moment is whether or not the Markets have bottomed – and it is certainly starting to appear that way. Later in this bit of scribbling I will throw in some Index Charts and as per the Educational Blog I wrote recently about how the Bottom in 2008/9 was flagged on the Technicals, I will be looking in particular at the 13/21 Day EMA lines and in a couple of weeks we will get a good steer from the Monthly Candlesticks once April is completed.
The key event Technically this week was the Breakout Higher from ‘Cup & Handle’ Chart Patterns that I had highlighted on Twitter and were not just forming on Major Indexes but had also appeared on many individual Stock Charts (needless to say, if you don’t look at my Twitter Feed then you could be missing a lot of my thoughts that I tend to throw out as they formulate in the WheelieBrain – if you don’t have a Twitter Account then you can just look at the Feeds that are embedded in several places on my Websites). As a result of this Bullish behaviour, I decided to Close the Short Positions I had running on the S&P500 and the FTSE100 and for a change I showed some discipline in this action and I get the sense it will pay off nicely as I am now nearly 100% Long. If you skip to my ‘Trades’ page on WD1 you can see more details about this.
Without doubt this is not a time to be complacent and I am reluctant to buy much although I will be considering a small Long Position on probably the S&P500 during the coming week. I will be using a Stoploss and hopefully my newly found discipline will continue and if there is upside to be snaffled then I will be onto it. I will be monitoring the situation closely as always and if I sense that things are going to turn turtle again, then I will be ready to go Short on an Index if need be.
I have to say I do find the bullishness rather surreal and it doesn’t seem justified by much on the Fundamentals side but I have learnt through expensive and bitter experience not to fight the Markets. Let them do what they will do and just exploit that, has to be my new mantra. I sent out a string on Tweets about this recently and in essence I am guessing that the Bullishness results from Market Participants judging that Lockdowns are not going to last for long (I have to agree with this because the Economic damage of a long Shut-down of Economies will cause considerably more health problems and deaths than the Virus ever will) and also the TINA trade (‘There is no alternative’) still applies to Stocks and this has become even more the case as Interest Rates have got even lower and Central Banks are doing yet more interventions in the Markets. At the moment a lot of Dividends are being axed but I think it is highly likely that we will see a lot of Special Dividends in time to make up for these, and there is no getting away from Stocks being the best place to look for yield. If we then lob on top all the immense ‘Stimulus’ measures that all governments and bodies such as the EU are taking, then provided that Lockdowns don’t drag on too long, then it is quite likely that the Rebound can be very rapid and it does run the risk of being too ‘hot’ and the Central Banks perhaps needing to calm things down further down the line. It really has been historic times in every sense and it seems like much of the stuff we have learnt over the years is pretty much irrelevant and it simply comes down to not fighting the direction of the Markets. Remember, ‘The Trend is your Friend’, and there is certainly a lot of truth in that. As usual I was reading all the RNS Updates in the morning that interested me during recent weeks and one thing that has hit me is that obviously many Companies are really struggling, such as those in the Airlines and Retail sectors, but there are many others that have barely even registered that there is a problem – and some of those were quite surprising really. If and when things get back to some sort of normality (I suspect any removal of Lockdowns will be a steady and phased approach), then Companies that have weathered the difficulties very well will probably continue to do well and the ones that have been massively battered, will rebound like the Space Shuttle with a Saturn V stuck underneath it. One Stock that I hold which particularly impressed me last week was On The Beach OTB – they have an incredibly low cost model and once Planes can start flying again, I suspect that OTB will be very well placed with much less competition as so many will have collapsed. Also Iomart IOM that I hold had a good Update and should be well placed – and it has looked good value for quite some time really. Last Week Well, the bullishness in the Markets translated fairly well into my Portfolio last week despite the Shorts I had running for much of the time and my Stocks recovered about 5.9% which is a massive week really. In more normal times I would never see gains of such a magnitude but of course things are still very unusual. As a result of this bouncing my Portfolio is now down 13.4% since January 1st and it is almost like we never had all the pandemonium of recent weeks. On that theme and related to what I was talking about earlier, it is starting to look like the ‘Capitulation’ that we normally expect to see as a Market Bottoms was actually in those 2 bonkers weeks we had where things were indeed quite scary and panicky and there was no logic to the selling with pretty much everything collapsing at the same time. Blog Slate My main focus recently has been to get these Websites converted to the new Theme and I have pretty much got WD2 to a state that I am happy with. It is by no means perfect but I am bored with messing about with it !! My next task is to get WD1 converted and unfortunately I was hoping that I could just go into the Weebly Editor and click a few buttons and WD1 would magically look like WD2 does now, but on further digging in the Support Menu it looks like it is not that easy. I think it will be simpler for me (although more long-winded) to just ‘knife & fork’ the changes and if I can knuckle down to it then it can probably be done in just a few hours. As a result of the Hedging I have been doing during this messy period I have some thoughts and observations that I want to get down on electronic paper and I will write a short Blog about this in the coming week once the Websites are both on the new Theme. I think we are due to produce another TPI Podcast later this week and that is something that should be quite interesting because a lot is happening (if you haven’t heard it yet, TPI 20 is the latest one and you can find it on the ‘Twin Petes Investing Podcasts’ page which is on WD2). I am also aware that I have not done anything to the ‘Weekly Performance’ page recently so I intend to tart that up a bit as well but that is likely to be a couple of weeks away. A Previous Easter Sermon I just mentioned OTB as an interesting Stock and I recommend that you read the Update they put out a few days ago and take particular notice of their incredibly low Cost Base (one 20th of a ‘normal’ Travel Agent). In addition, here is a blog I wrote about them a couple of years ago which might help you weigh up whether or not they are worth holding: https://wheeliedealer.weebly.com/educational-blogs/on-the-beach-otb-buy-rationale OK, let’s see what the Charts are telling us about ‘The Bottom’……. S&P500 As always, the Charts I show are taken from SharePad and if you click on them they should get larger on your screen so you can see more details. First up I am focusing on those 13 and 21 Day EMA Lines and my Red Arrow on the Chart of the S&P500 below is pointing at where they are lining up a Bull Cross (the Black Wavy Line is the 13 Day EMA and the Red Wavy Line is the 21 Day EMA) but it has not yet happened. It might not happen of course. 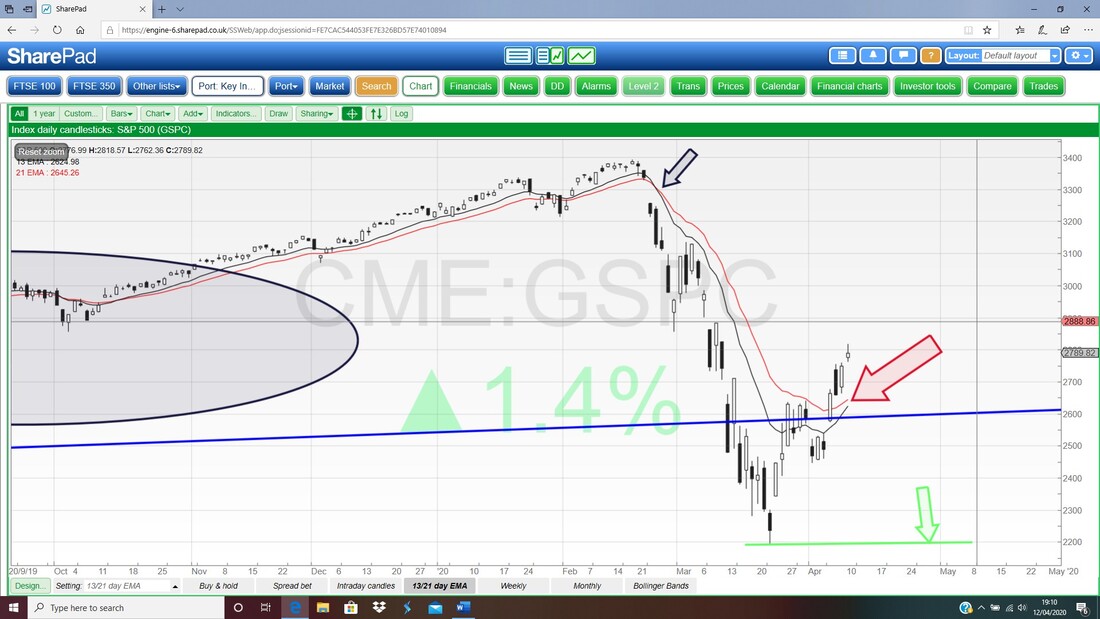
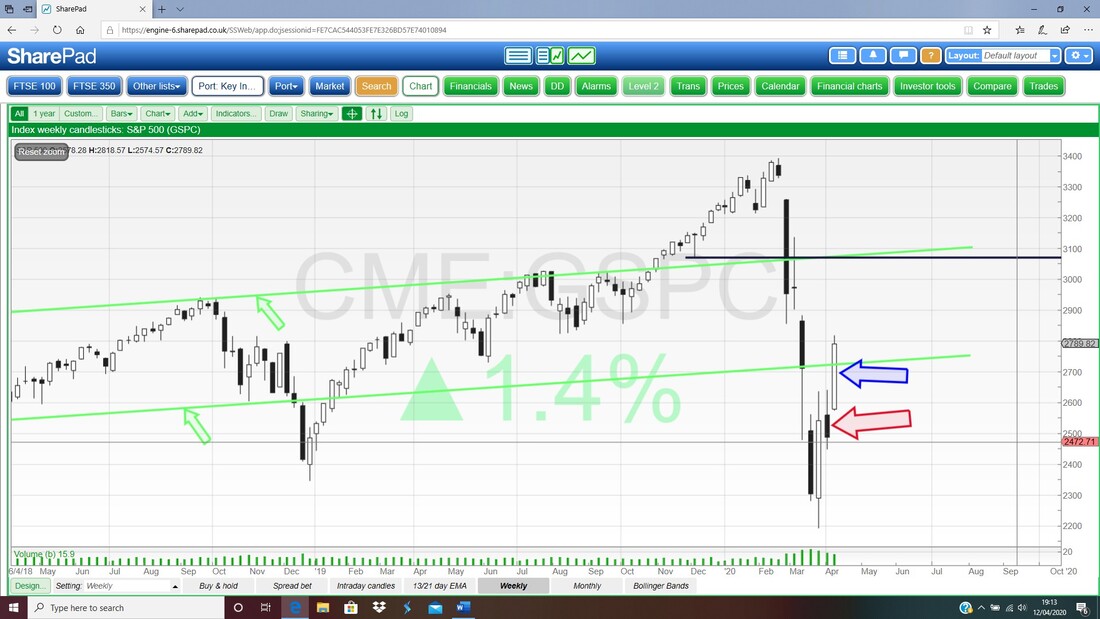
Next I am showing the Weekly Candles for the S&P500 and this is very interesting. Note firstly my Red Arrow which is pointing to the Candle from 2 Weeks ago and that was distinctly Bearish looking and the fact that last Week we got a big White Up Candle (marked by my Blue Arrow) which broke above the Resistance from the previous Week, is Bullish Price Action.
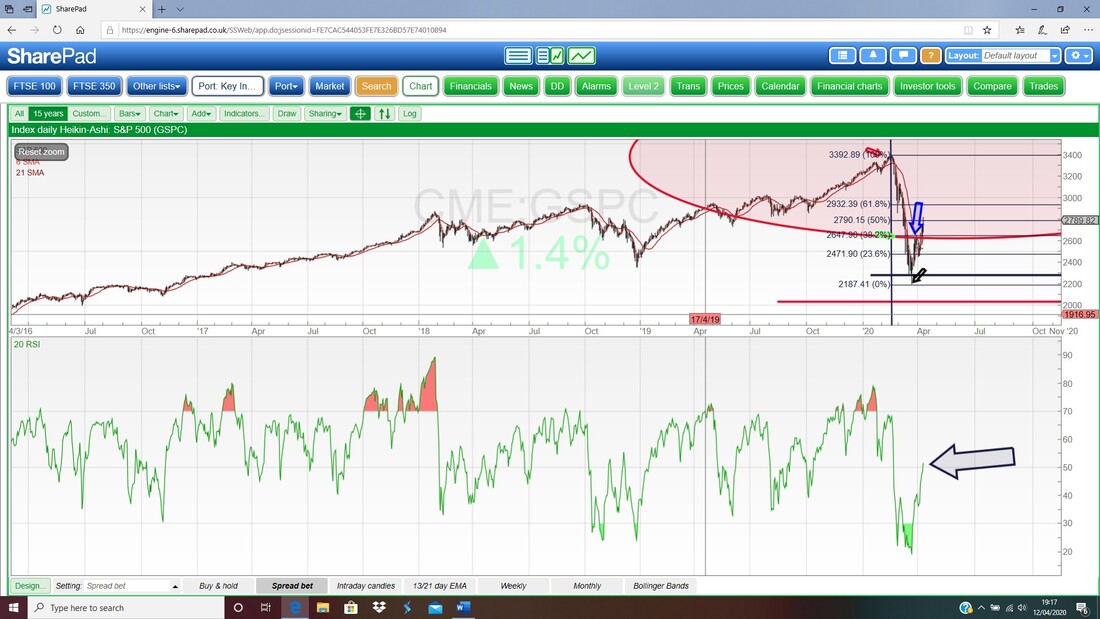
In the bottom window on the Screen below we have the RSI (Relative Strength Index) for the S&P500 Daily and on a Reading of RSI 52 where my Black Arrow is, this is around Neutral and neither Bullish nor Bearish but the direction is upwards and if it wants to keep rising, there is plenty of scope within the RSI for it to do so.
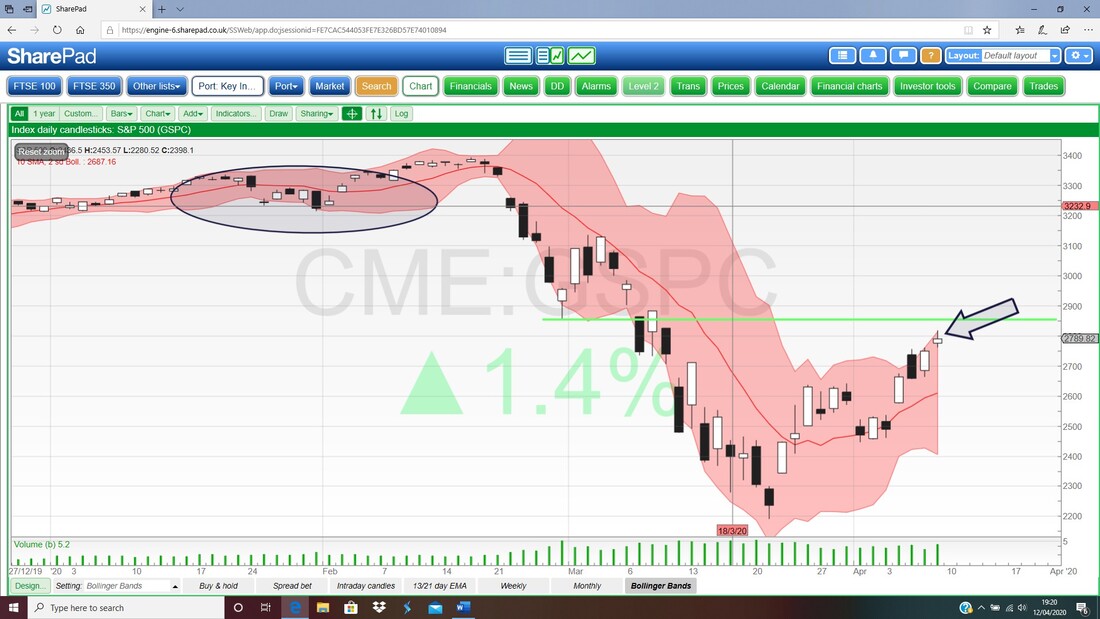
Lastly for the S&P500 we have the Daily Candlesticks with the Pink Zone marking the Upper and Lower Bollinger Bands. My Black Arrow is pointing to the Candle from Thursday and note this is up at the Top Bollinger Band so that might limit upside in the near term and note also that the Candle from Thursday is a bit like a Bearish Shooting Star with a longer Tail pointing upwards than the Tail that is below – this suggests it might ease back a bit before moving higher if that is where it is ultimately going. The fact it broke above Resistance at around 2640 is a Bullish development.
Nasdaq Composite
I won’t dwell on this one but I had a quick look at the 13/21 Day EMA Lines for the Nasdaq Comp and where my Blue Arrow is you can see they are getting pretty near a Bull Cross – it might not happen, but if it does it would be a strong suggestion that we are over the worst and a Proper Bottom is in. Note also my Black Parallel Lines – these are an attempt to draw an Uptrend Channel which is a bit early and it may be that I am totally ‘wrong’ here but it is something to track how it plays out. 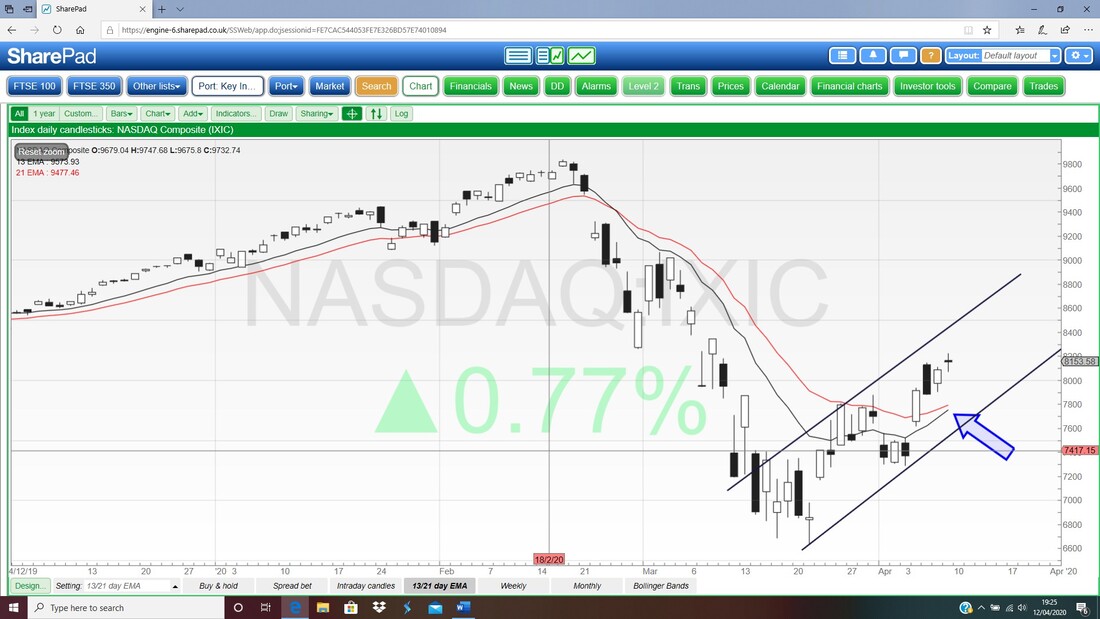
From a quick look at the DOW and the DAX30 they are both lining up 13/21 Day EMA Bull Crosses, but I won’t show them here. If you do look at the DOW, I will draw your attention to the Candle from Thursday and that definitely has the look of a Bearish Shooting Star, which suggests a pullback in the near term but does not mean any kind of Bullish move is over.
FTSE100 First up the 13/21 Day EMAs and as you can see where my Red Arrow is, they are very near a Bull Cross. 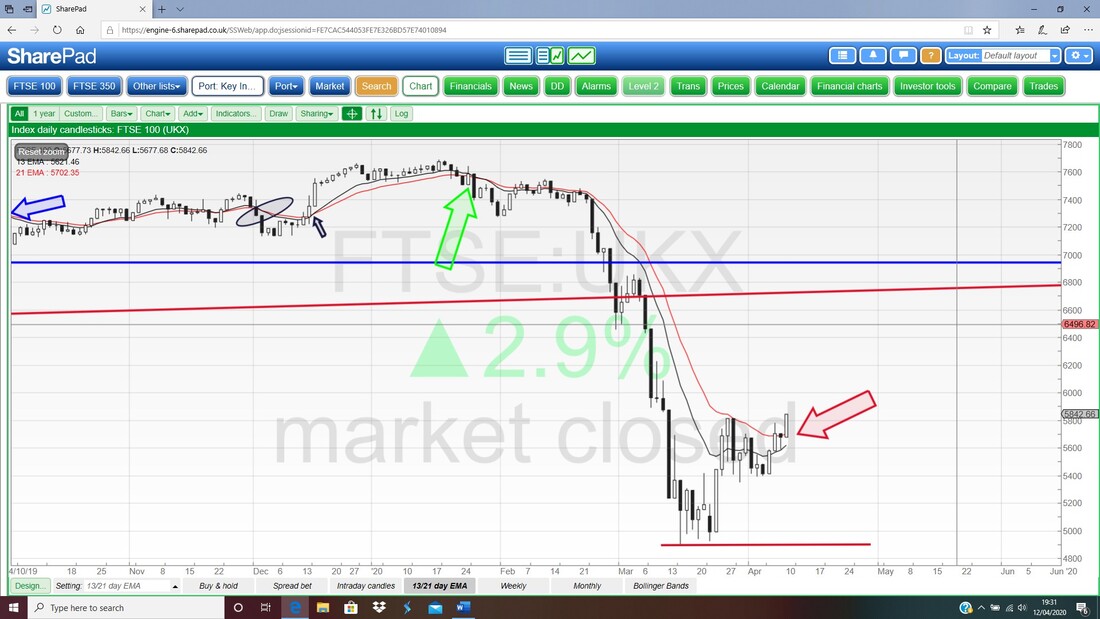
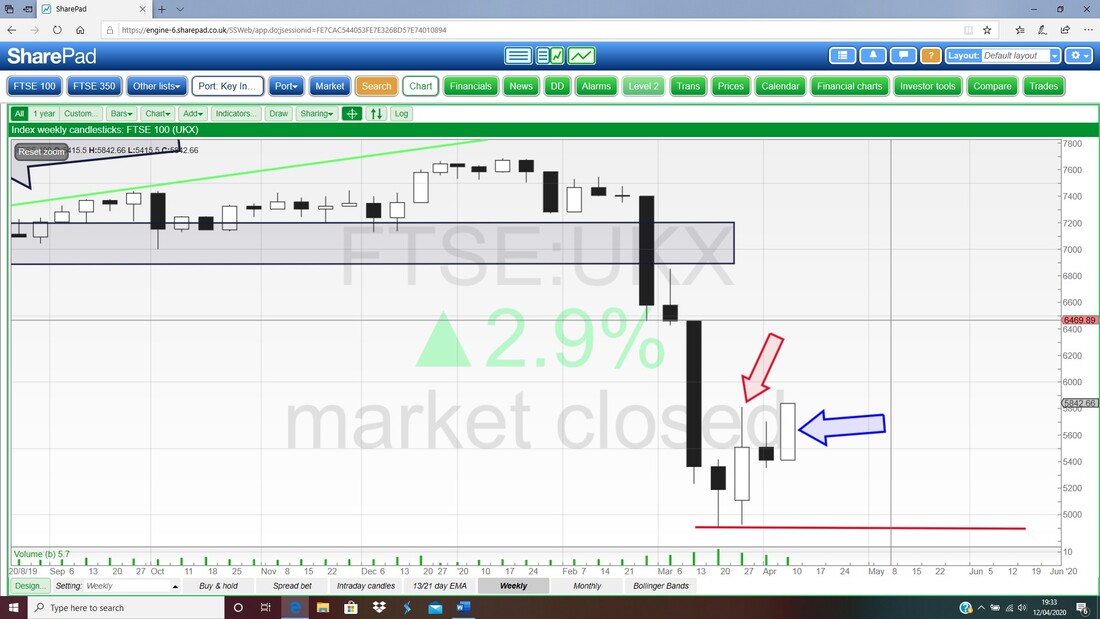
Next we have the Weekly Candles for the FTSE100 and my Blue Arrow is pointing to a Big White Up Candle from last Week and this looks Bullish – particularly because it has got above Resistance from the Top of the Candle from 3 Weeks ago which I am pointing at with my Red Arrow on the Chart.
In the bottom window on the Screen below we have the RSI for the FTSE100 Daily. On a reading of RSI 44 where my Black Arrow is, this is heading up towards Neutral and there is clearly lots of ‘room’ for the Price to rise or fall as it sees fit.
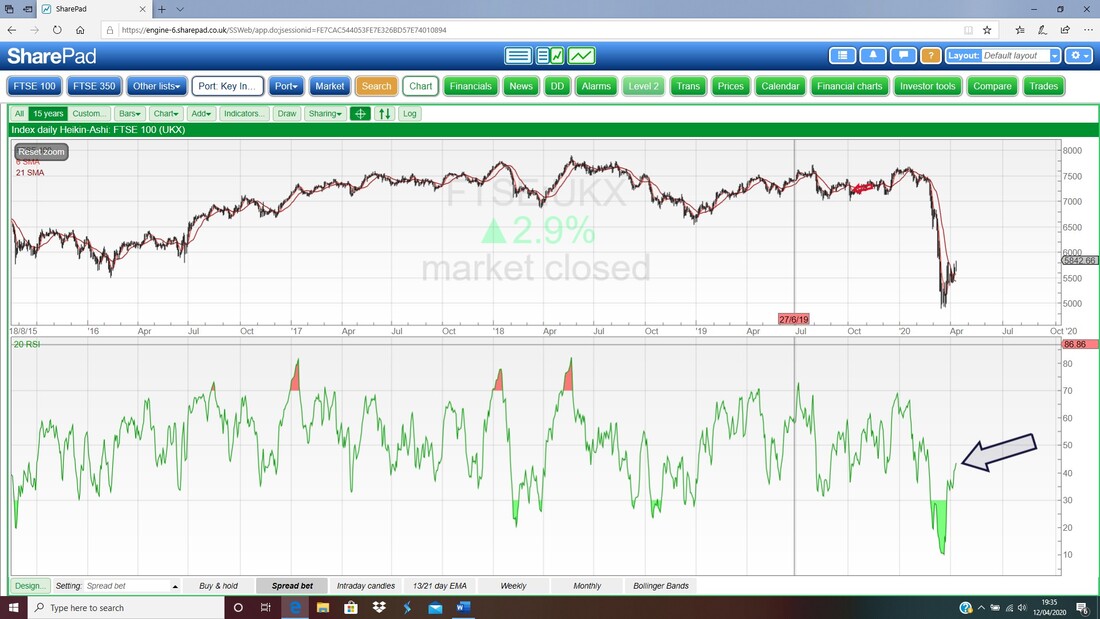
The final Chart tonight is a bit busy but I will try and guide you slowly through it. First up look at my Red Arrow which is pointing to a nice Up Candle from Thursday and this looks Bullish – particularly because it has broken above my Blue Line of Resistance which is at 5815 and marked by the Blue Arrow.
I would expect 6000 to be psychological Resistance and if it can get through this then there is Resistance at 6231 which is where my Green Line is (Green Arrow). Note that the Candle from Thursday is up at the top Bollinger Band so that could limit immediate upside – especially if the US Markets ease back a bit as those Bearish Shooting Star type Candles which I showed earlier play out. I have attempted to show the Bullish ‘Cup & Handle’ Pattern on this Chart which I have been going on about a lot on the Tweets. My Big Blue Ellipse is trying to point out the ‘Cup’ bit and my Black Ellipse is trying to mark the ‘Handle’ bit. There is another Bullish development here – the fact that the Candle from Thursday broke-out over the Resistance at 5815 where my Blue Line is also coincides with a Break-out of the Bullish Cup & Handle Pattern (5815 marked the ‘Lip’ of the Cup). However, things might not be so great and this could be an overshoot and we might drop back – personally I doubt that but we need to be on our guard. Right, that’s it for tonight – good luck in the coming week and don’t do anything daft. Cheers, WD. 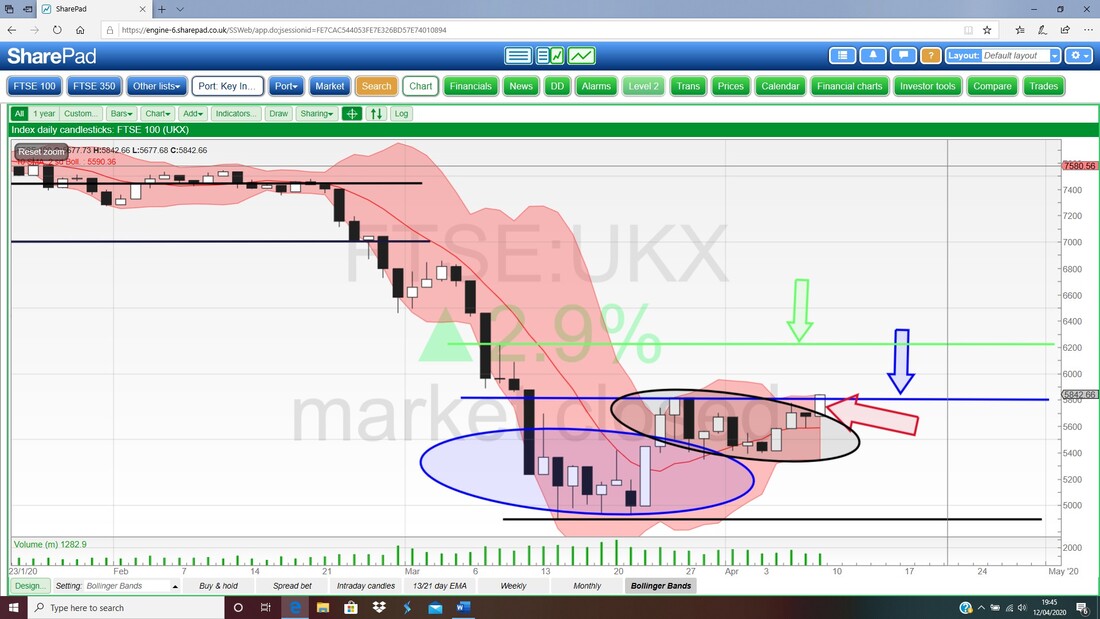
0 Comments
Leave a Reply. |

Stocks & Markets WheelieBlogsThese tend to be more Markets and Stocks related and timely - the Blog Page on the Main WheelieDealer Website has the 'Educational' stuff (well that's the theory anyway !!). Archives
October 2021
Categories
All
|
