

|
stocks & Markets blog |
|
Quite a tough week just gone by with Thursday being particularly painful although things calmed down a bit on Friday and perhaps the Markets can turn up off of this. I will go into the Charts later in this Blog and I expect to see quite a few signs that we are near pretty solid Support and a move up is quite likely.
Something to watch out for is that there is talk of a ‘Second Wave’ in Beijing, China, where apparently a localised Lockdown has been put on again. There is a lot of fear about a Second Wave and I am not convinced it is anything more than scare stories but it is something to keep an eye on because the Markets might get a bit frightened if they feel major Economies might go into Lockdown again with the associated crushing impacts on GDP etc. I have also noticed some talk of Iran having another Outbreak – again worth keeping tabs on.
Last Week
After finally seeing my Portfolio back into positive territory for 2020 Year to Date, it is quite typical that the Market kicks me in the butt and I am back down to Minus 4.4% since January 1st and this was after a drop of 5.1% last week which is a big hit. I see no reason to change my Strategy and I am on alert in case there is a bigger fall although I see that as unlikely. At the moment I am pretty much 100% Invested in my Share Portfolio and I have some Long Spreadbets on the FTSE100 and I would like to add to those if I see some strength returning. If things stay wobbly and I get the appropriate Bearish Sell Signals on the Charts (mainly a 13/21 Day EMA Bear Cross), then I might look to Hedge again with some Index Shorts. I am casually considering some Stocks for my Income Portfolio as I have a spare bit of Cash there and I might buy something new. Having said that, I am tempted to simply buy more GlaxoSmithkline GSK as that looks pretty safe and still has a Dividend Yield around 5%. I am in no rush. There is a Stock that I hold as normal Shares but I do not have a Long Spreadbet on it and I want to pick that one up soon. It has been dropping back and looks good value where it is and I am just waiting for the falls to stop so I can buy it as it starts to move up – which is something I always prefer to do. Blog Slate I’m typing this section on Saturday Night and I have just about an hour ago issued the Educational Blog about ‘Optimising Wheelie’s Wash Plant’ which I think Readers will find an unusual but quite thought provoking read that could make a big difference to how you view your own Investing/Trading. I like to write stuff that you are unlikely to find anywhere else but that is based in reality and extremely relevant to how I do things and what I am doing with my own Portfolio and how I tackle the Markets – I think I have managed that with this one. That Blog follows on from a string of Tweets that I sent out about a week ago which were all about how I was taking a ‘Systems’ approach to how I do things and I have captured those Tweets into a Blog Draft and I expect to issue that one probably not in the coming week but in the week after. This week I will most likely be recording a new Podcast with Peter C3. I have another idea for an Educational Blog which again is quite unusual but I know it will be very popular with a small subset of Readers and I also have several Guest Blogs in the pipeline that are being tweaked and tarted up. So there should be plenty of Blogs to come. If you haven’t heard it yet, the most recent Podcast was TPI 24 and you can hear that one on the link below: https://soundcloud.com/user-479955511/conkers3-wheeliedealer-24-is-cash-king-gaw-fdev-fevr-ajb-hl-grid-hfd-ocdo-php-luce From deep in the Catacombs For a change, here are a couple of totally different Guest Blogs for you: https://wheeliedealer.weebly.com/educational-blogs/guest-blog-to-understand-the-future-you-must-know-the-past https://wheeliedealer.weebly.com/educational-blogs/guest-blog-from-traderdiarycouk-keeping-it-simple Right, let’s see what’s in the tealeaves…… Brent Oil Composite As is always the case, the Charts are taken from the excellent SharePad software that I use and if you click on them then the images should get a bit bigger on your screen so you can see them in more detail. First up we have the Daily Candlesticks for Brent Oil Comp but what I am most focused on here is the Bull Cross where my Green Arrow is between the Black wiggly 13 Day EMA Line (Exponential Moving Average) and the Red 21 Day EMA Line. This is still in ‘Bull Mode’ which suggests Oil can still go up. One of the delights of the 13/21 Day EMAs is that they keep you in a Trade when things go a bit wobbly for a short period. In simple terms, it is rarely a good idea to trade in the opposite direction to what the 13/21 is telling you to do I find. Many people use ‘faster’ EMA Crosses such as the 8/21 or 8/30 etc., but I find with those they kick you out of a good Trade too early. The beauty of the 13/21 is that it gives reasonably fast yet reliable Signals and surprisingly it works very well across a vast number of Assets. My miserable attempt at a Blue Parallelogram tries to capture the Big Black Down Candle from Thursday and then the smaller White Candle from Friday. The context is not ideal because it would be better to have a sustained downmove before such a 2 Day Pattern, but it does look like a Bullish Harami and I expect the Price will move up off this. My Black Arrow is pointing to Resistance at $43.4 which is next up. Fundamentally it makes total sense that Oil rises as Economies gradually fire up again. 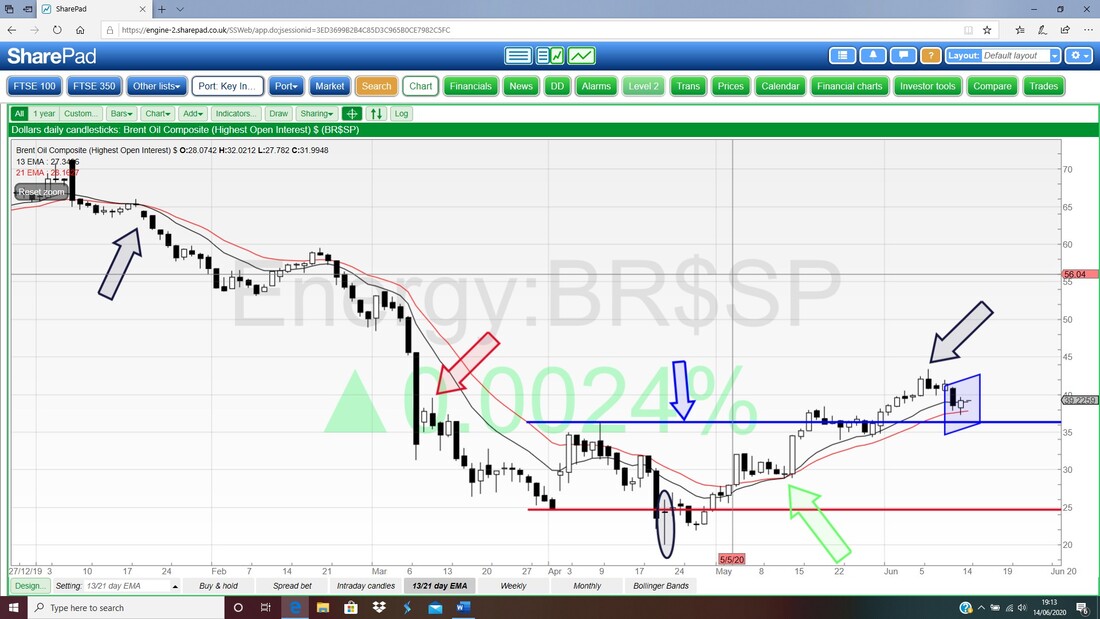
In the bottom window on the Chart below we have the RSI (Relative Strength Indicator) for the Brent Oil Comp Daily. On a Reading of RSI 58 it has taken out some over-boughtness but it is still a relatively high level. However, with a strong Uptrend an Asset can have quite high levels on the RSI for some time.
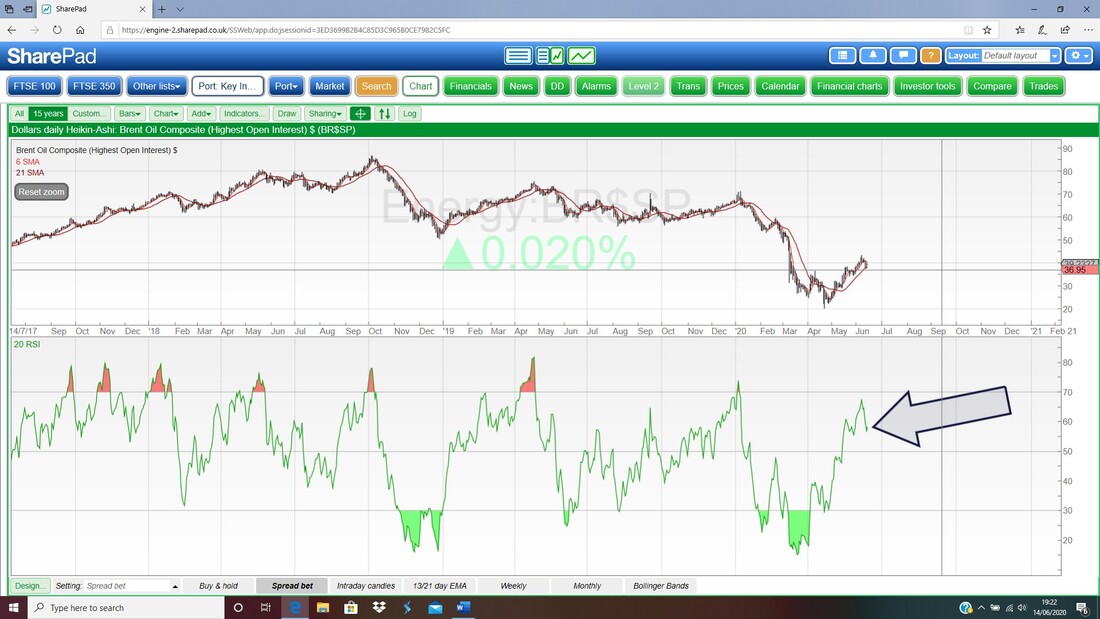
However, on the Weekly RSI below we only have a Reading of RSI 43 which suggests a lot of upside to come.
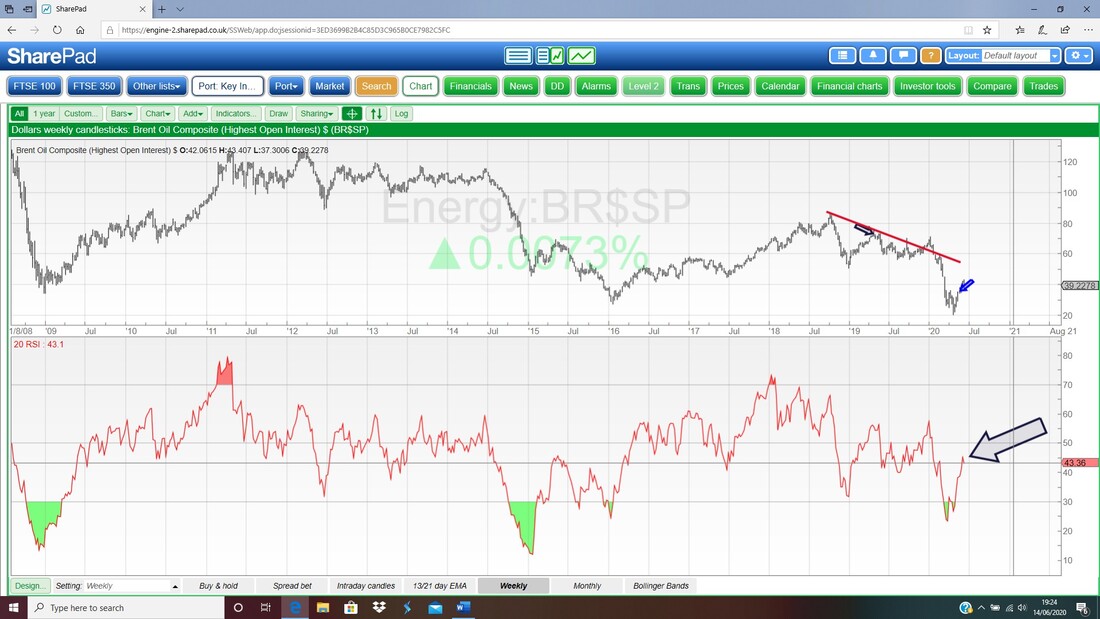
The Weekly Candles for Brent Oil Comp have some worrying aspects. My Blue Arrow is pointing to a Big Black Down Candle from last week but note it did manage to Close up off the Low which was at $37.3 which is now important Support.
In combination with the Candle from the week before this could be a Bearish Harami pattern – this suggests a drop. As I just said, the key is $37.3 and to the upside we are looking at $43.4 as I mentioned earlier. 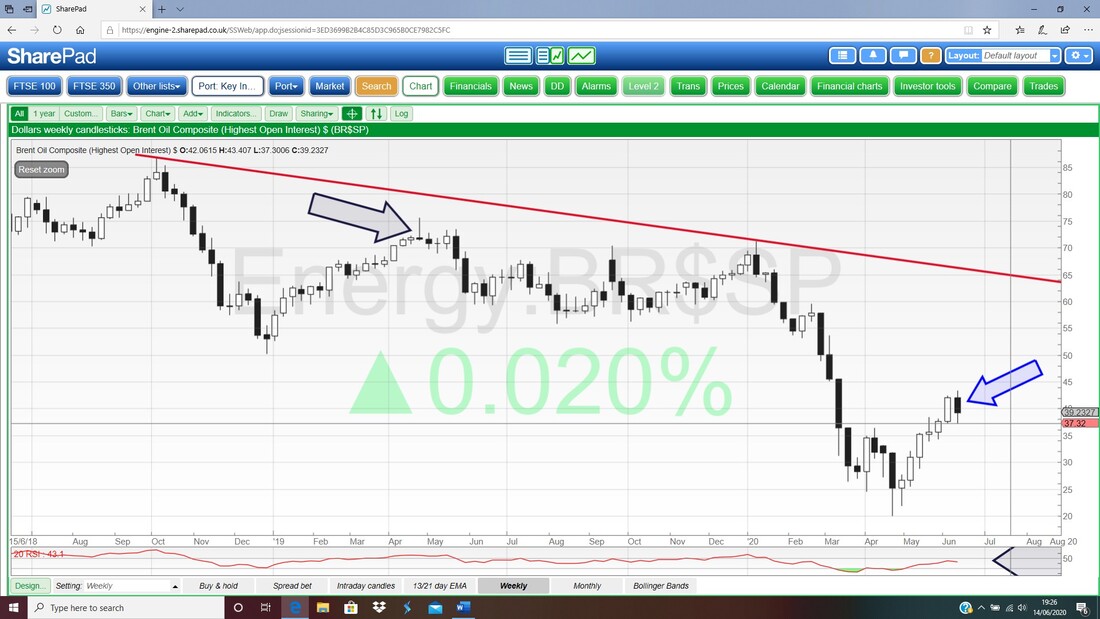
Last up for Brent we have the Daily Candles with the Pink Zone highlighting the Upper and Lower Bollinger Bands. My Black Arrow is pointing to the Candle from Friday and note how it dropped just a little below the Lower Bollinger Band but then moved up away from the Band which is textbook behaviour and quite orderly. It suggests more upside.
I read somewhere the other day that Shell RDSB/A and BP. alone are responsible for a 15% Weighting in the FTSE100 so any move up in Oil is highly likely to be good for the FTSE100. I have Long Spreadbets on the FTSE100 (see my ‘Trades’ page on WD1). 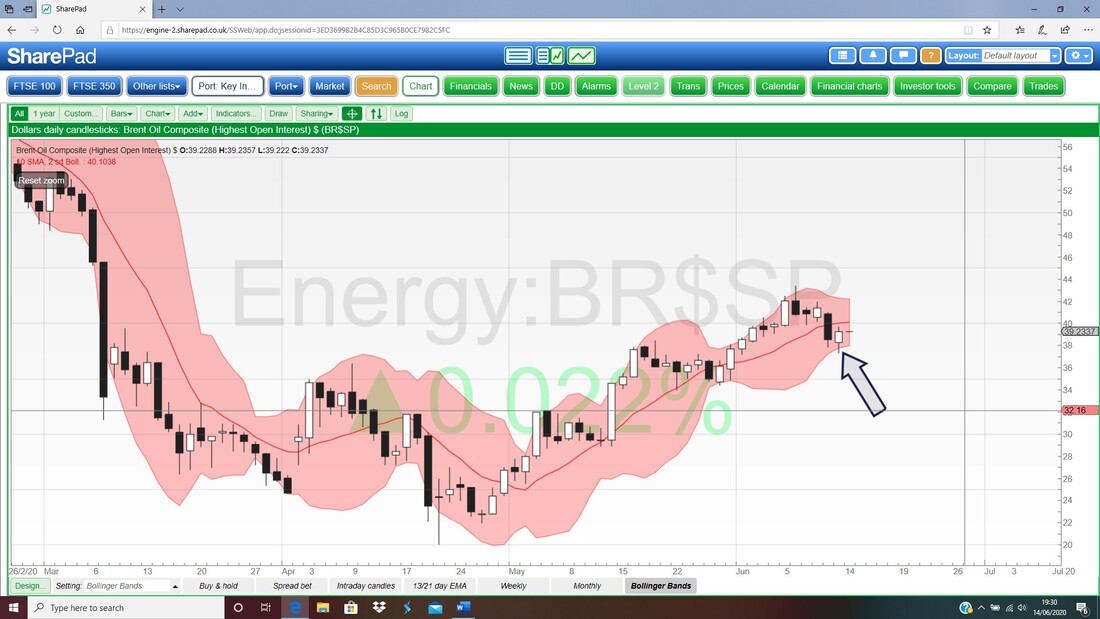
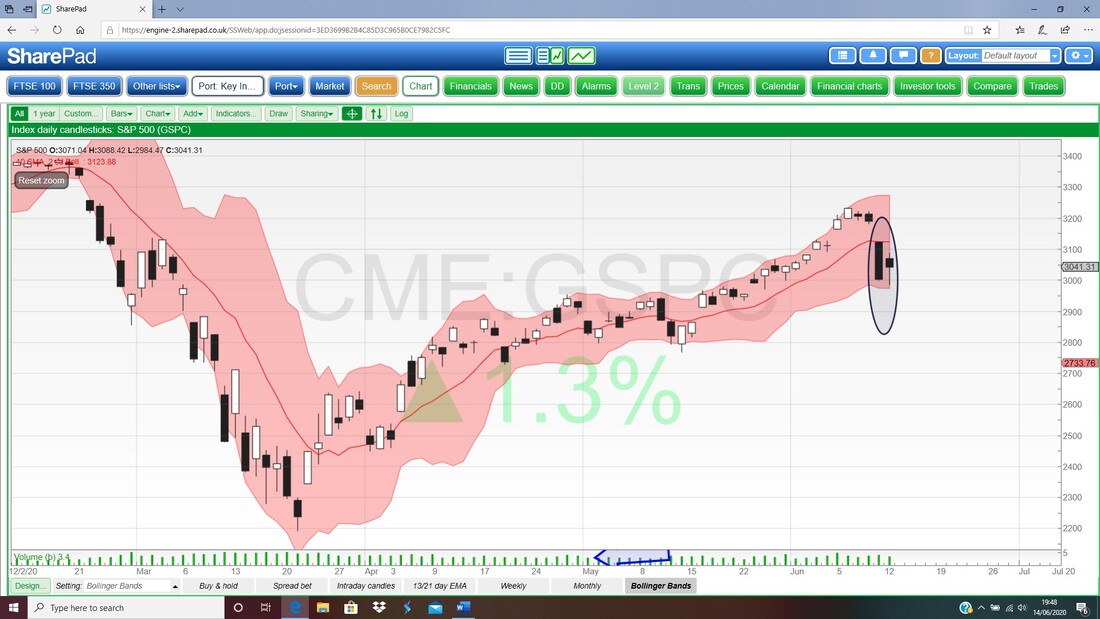
S&P500
First up the 13/21 Day EMAs for the S&P500. My Red Arrow marks a Bull Cross and this is still valid. My Blue Arrow is pointing to the Down Candle from Friday but note it is a bit of a Hammer although the context is not great – this probably means the S&P500 can rise off this and the key Level to watch is the Support at 2984 from the Friday Low. In combination with the Candle from Thursday you get a Bullish Harami and note the Gap up above the Thursday Candle which could close up fast if it gets in there. 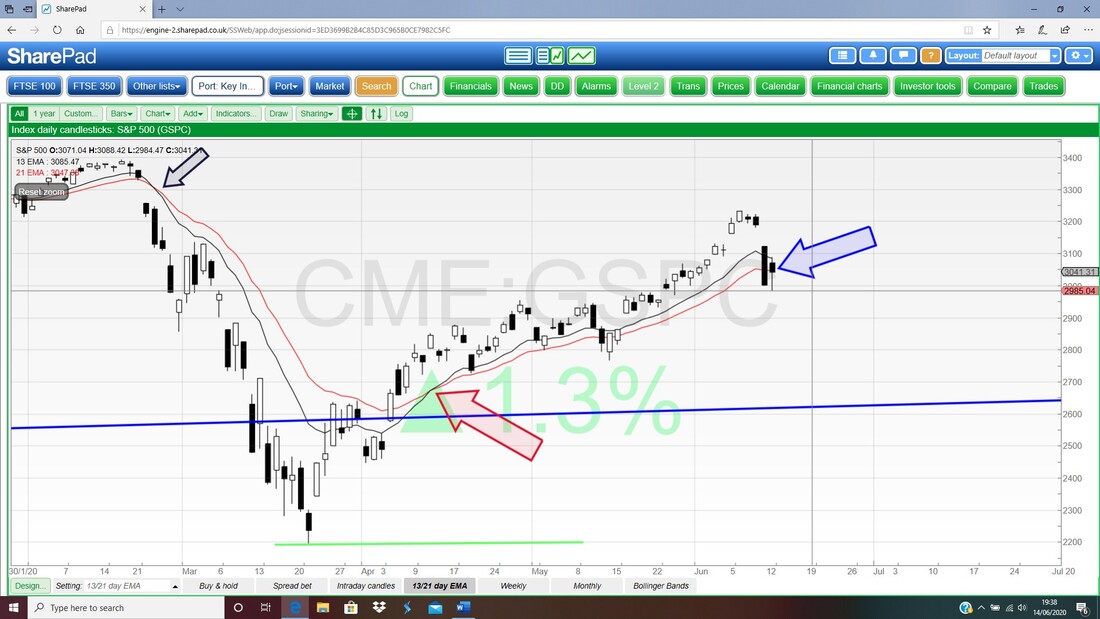
Like on Brent Oil the Weekly Candles for the S&P500 have some concerns. My Blue Ellipse is capturing a Big Black Down Candle from last week and this does look a bit Bearish !!
Again it is all about Levels. My Red Line at 2984 must hold as Support and the Black Line at 3233 is Key Resistance to get up above. 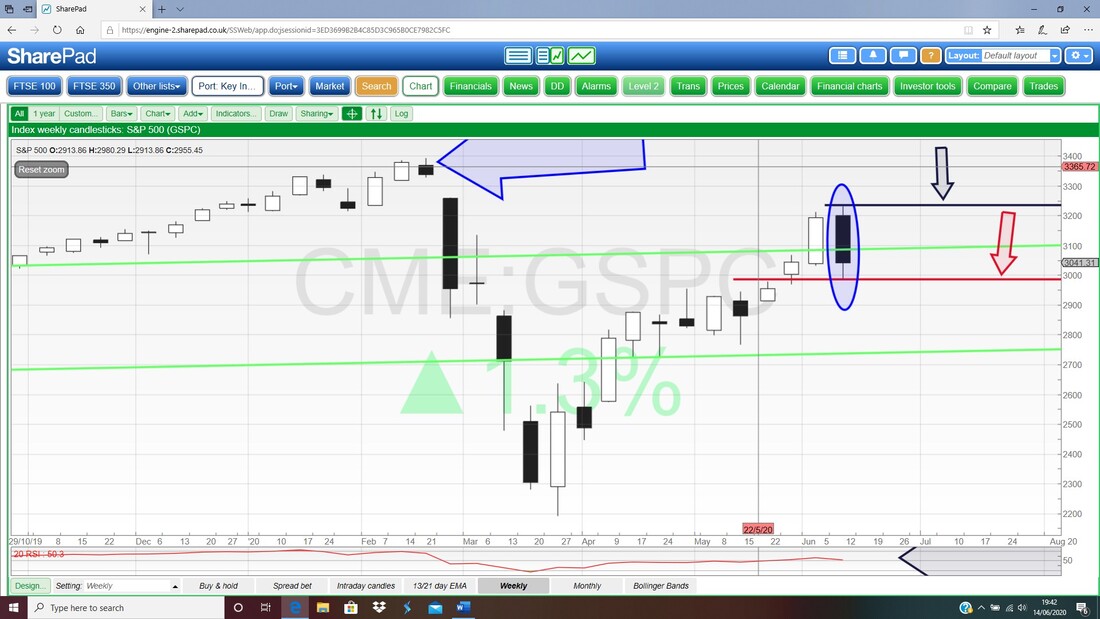
In the bottom window on the Screen below we have the Daily RSI for the S&P500 and on a Reading of RSI 54 where my Black Arrow is this has dropped back to near Neutral and this has taken out a lot of heat. It could easily rally from here.
The Weekly RSI is about the same so I won’t bother showing it. 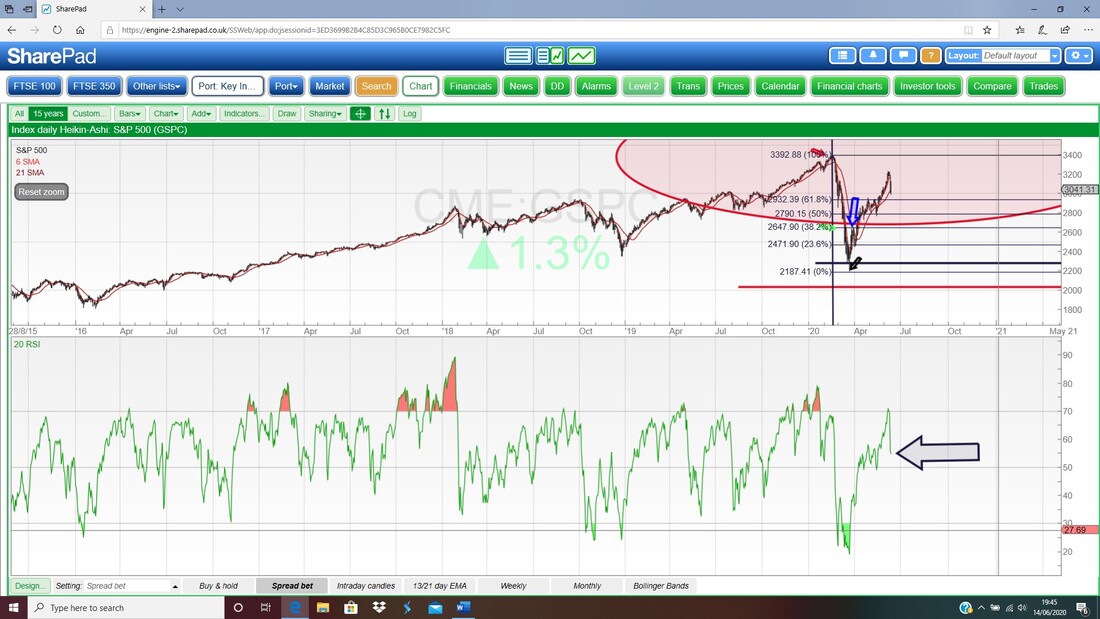
Regarding the Daily Candles and the Bollinger Bands, this situation is very similar to Brent Oil Comp.
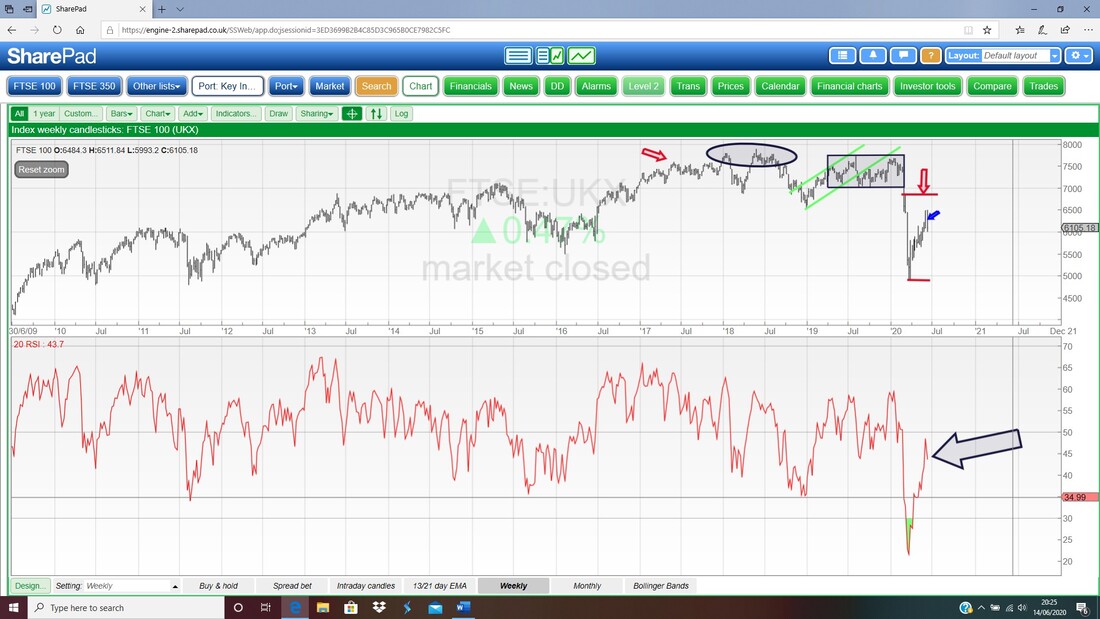
FTSE100
First up for the FTSE100 the Daily Candles and the EMAs and where my Red Arrow is there was a Bull Cross on the 13/21 Daily EMAs and this is still in force although note the Lines are moving close together so any further weakness and we would get a Bear Cross which would be a worry. My Black Arrow is pointing to a ‘Long Tails Doji’ from Friday and note how it recovered off the Low at around 6000 which is naturally a strong Support Level. In combination with the Big Down Candle from Thursday this is a Bullish Harami and implies a turn up. 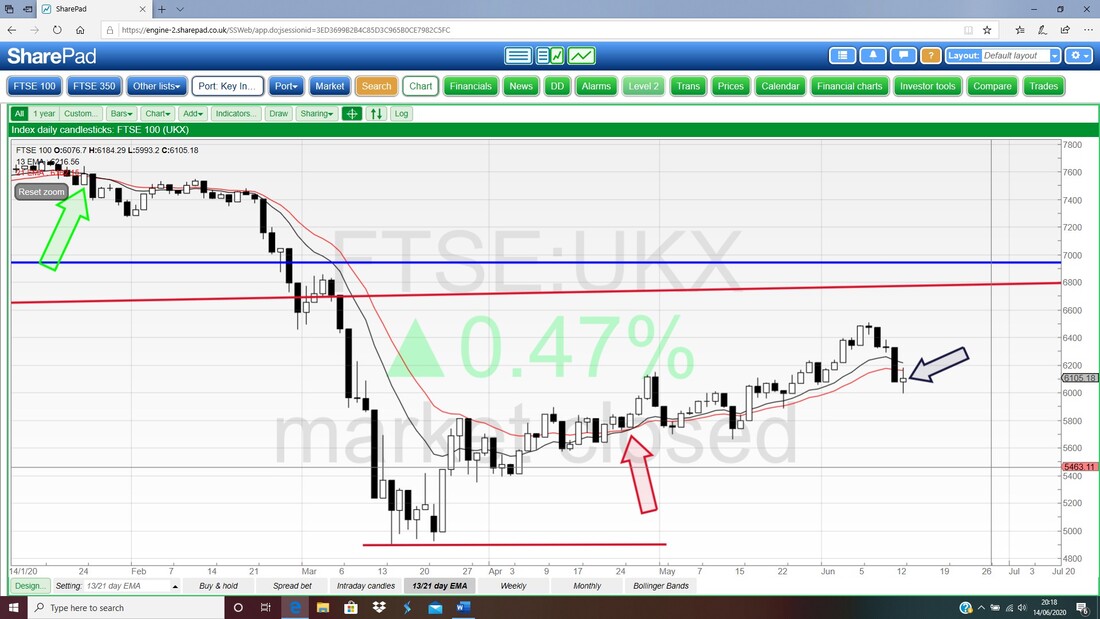
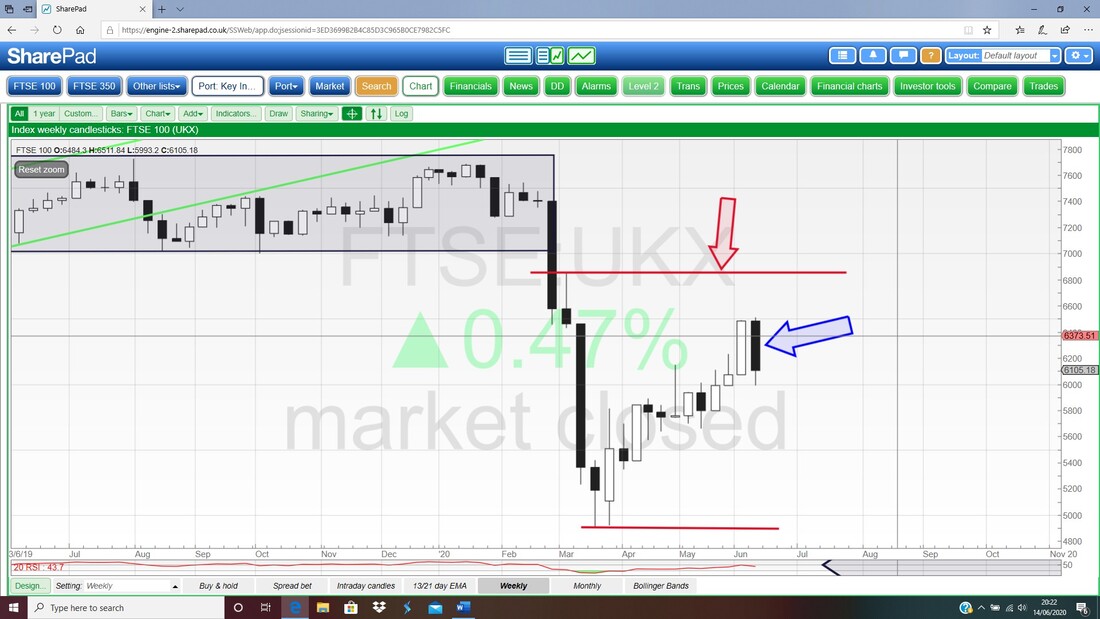
Like with the others I have shown, on the Weekly for the FTSE100 we have a Big Ugly Black Down Candle and this is Bearish on its own. As I have said, it is all about the Support at 6000 and this must hold and to the upside we are really looking at 6500 now.
In the bottom window below we have the RSI for the FTSE100 Daily and on a Reading of RSI 50 where my Black Arrow is this is Neutral. In other words if it wants to rise or fall there is plenty of room to move !!
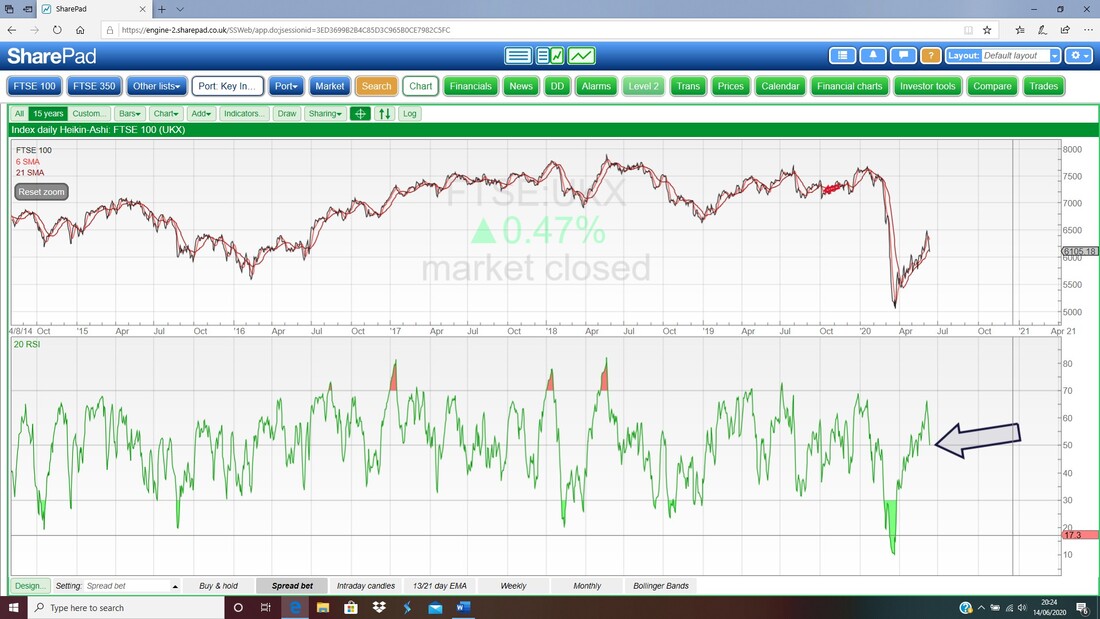
On the Weekly RSI below we have a Reading of RSI 44 where my Black Arrow is so this is a bit lower than Neutral and not Overbought nor Oversold.
And last of all tonight we have the Daily Candles for the FTSE100 and the Bollinger Bands. My Red Arrow is showing how like the other Indexes and Oil it found Support at the Bottom Bollinger Band and then moved up – that is nice. Note also the Green Parallel Lines which are suggesting a nice Shallow Uptrend.
Right, that’s it, Good Luck for the coming week and get out and enjoy the Sunshine if we have any. Screen watching is bad for your health !! Cheers, WD. 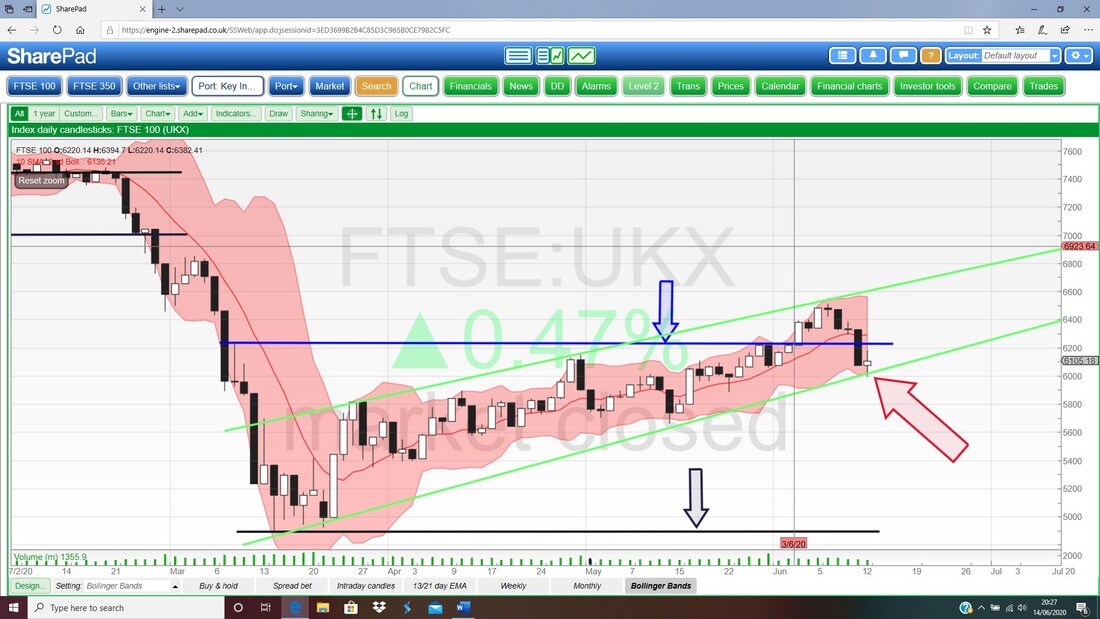
0 Comments
Leave a Reply. |

Stocks & Markets WheelieBlogsThese tend to be more Markets and Stocks related and timely - the Blog Page on the Main WheelieDealer Website has the 'Educational' stuff (well that's the theory anyway !!). Archives
October 2021
Categories
All
|
