

|
stocks & Markets blog |
|
Well there was quite a large event for my Twin Petes Investing buddy Peter @conkers3 and myself last week where the culmination of quite a lot of time and organisation and plenty of effort on all sides, led to the Launch of a Sponsorship deal of our Podcasts by SharePad/ShareScope. You can read about the arrangement in this Press Release and I have no doubt it will lead to a lot more initiatives etc in the future:
https://www.sharescope.co.uk/press_twinpetes_sponsorship.jsp Of course I am extremely happy about this Partnership as it is a vote of confidence from a serious Company in the Private Investor/Trader space and certainly is a solid motivational boost to keep doing what I have been doing for the last few years and to try to keep developing it as much as I can. Clearly there are personal benefits but I am very keen to ensure that Readers can gain from such arrangements as well so fingers crossed this is the direction of travel.
Along with that Announcement, we issued a new Podcast which is TPI 22 and you can hear it via this link on Soundcloud and if you use Apple and/or Audioboom as your preferred platform, then if you go to the ‘Conkers Corner’ Channel you should be able to find the Podcast on there:
https://soundcloud.com/user-479955511/conkers3-wheeliedealer-22-the-winning-covid19-stocks-boo-cmcx-igg-odx-avct-plus-tsla I have also rejigged the ‘Twin Petes Investing Podcast’ page on my WD2 Website and it now has embedded Soundcloud Files so you can just click on them and they play straightaway. This is set up for all 22 episodes of the Podcasts and it is a huge improvement – nip over to the page and have a look because it is way better and a lot easier for WD Readers to use. Last Week I have no idea what happened in the mere 4 days that the UK Markets were open last week because miraculously my Portfolio added 4.6% which is a truly enormous result when you consider how many Stocks I hold and the fact that I don’t ever seem to do much !! I am not sure what really drove it but I had a couple of days where loads of my Stocks went up and there were some sizeable gains. On top of that I have Long Spreadbets on the FTSE100 and the S&P500 and they went my way I think. On top of all that, these Results for last week do not include Friday and my S&P500 Long added a bit then as well which will roll into next week and give me a reasonable start. Knowing how things go, it will all drop on Monday and be irrelevant anyway !! It is really pleasing to be seeing the Losses on my Portfolio since January 1st 2020 to start coming down and the Portfolio is now down a bit less than 8%. It is really welcome because it is getting near the level where I can start to imagine that breakeven is a real possibility and perhaps if I can do the right things at the right time, then I could even end up positive for the year. Going back a few weeks to that complete panic and chaos that was around with the Markets tanking dramatically, it certainly seemed at the time that a gain for the year overall would be complete and utter fantasy. Obviously there is a lot of year to go and the Economic backdrop is utterly dire, but with some studious Hedging and suchlike if I see the need to, I might be able to get through it ok. In terms of my Strategy, I am changing nothing. I am pretty much 100% Invested in terms of my Shares and I also have those Long Spreadbets so my Long Exposure is actually up to about 150%. Clearly that is a fair bit of Exposure so I am being extremely careful and if I see a need in the Charts to take some Exposure off then I will do so. As it stands, I suspect the Charts are still very Bullish and whilst that is the case I am riding the Uptrend whatever the scary Macroeconomic Numbers etc. throw around. I will cover the Charts later in this Blog. Something that I am very intrigued by is the Oil Price and my hunch is that this could start recovering as Countries come out of Lockdown (apart from the UK it seems who are merely going to be allowed to go to a Garden Centre !!) and if we do see Oil rising, then I expect big Oil Companies in the FTSE100 and big Resources Stocks like BLT, GLEN, AAL, etc. to rebound as well. If I am right, then my FTSE100 Long position could work out very nicely. Something that stands out to me about Oil is that everybody is a Bear and we also had the Mainstream TV News talking about it when the Price of WTI went hugely negative – it is often the case that a Market bottoms when the Mainstream News starts majoring on the story. Blog Slate For various reasons I thought it would be a worthwhile exercise to write an Educational Blog about what my Approach is but at a high level and with plenty of Links to other Blogs that I have written that contain the details. On top of this, clearly the ‘M3 Manifesto’ page on WD1 has a lot about how I do things but I thought some clarity would help Readers (particularly new Readers who have only discovered the whole WD fiasco recently) and it would also help me to get it down in word form which makes me think about it as I type. I have made pretty good progress so hopefully I can complete it and publish it later this coming week. After that I am not sure what I will write but I suspect something will come up !! Oh, I still need to update that ‘Weekly Performance’ page and I must put some focus on that although I would like to get the Approach Blog completed as a priority. Last week I added a couple of Non-Finance Books to the appropriate page on WD1 and there are short Reviews with one being a really good sort of fantasy/historical kind of story and the other is about the experiences of a Chinook Helicopter Pilot out in Afghanistan. I have loads more Non-Fiction Books to add and I will try to get these done steadily over coming weeks. Tucked away in the Basement I think it was the week before last that my mate Phil Sloan kindly produced a Guest Blog that had an Income Portfolio angle to it and this was received with rapturous applause on Twitter and was clearly much appreciated. I have noticed a few times that Guest Blogs written by Phil always go down a storm and I also sense that a lot of Readers are interested in the concept of Income Portfolios. For that reason, I have included a Link below to the final part of a Series I wrote on the subject a while back and at the top of this one you can find Links to all the earlier parts: https://wheeliedealer.weebly.com/educational-blogs/the-joy-of-income-portfolios-part-7-of-7 As ever, if you go to the ‘Blog Index List’ on WD2 you can see the full list of Blogs that are on the Websites and they have Links on all of the Educational ones so you can go direct. Better look at that Oil Chart then. Brent Oil Composite As ever, the Charts I show are taken from SharePad that I use myself and have done for probably nearly 20 years (formerly as ShareScope) and if you click on them they should grow larger on your screen so you can see more detail. The Chart below has the Daily Candles for Brent Oil Composite but what I am really interested in here is where my Green Arrow is which is pointing to a ‘Bull Cross’ which looks nailed on between the Black Wavy 13 Day EMA Line (Exponential Moving Average) and the Red Wavy 21 Day EMA. These Crosses are by far my favourite Indicator and I find them to have huge predictive capabilities and they are highly reliable. Usually a Bull Cross will lead to several weeks of gains. $36.4 is an important Resistance Level and this is where my Blue Line (Blue Arrow) is and if it can get above this, then just under $40 is Resistance. My Black Ellipse right at the bottom is highlighting a ‘Hammer’ sort of Reversal Candle from 22nd April 2020 and it looks like this was the Turning Point from which recovery has started (I have not checked but I assume this was the day when WTI went negative). 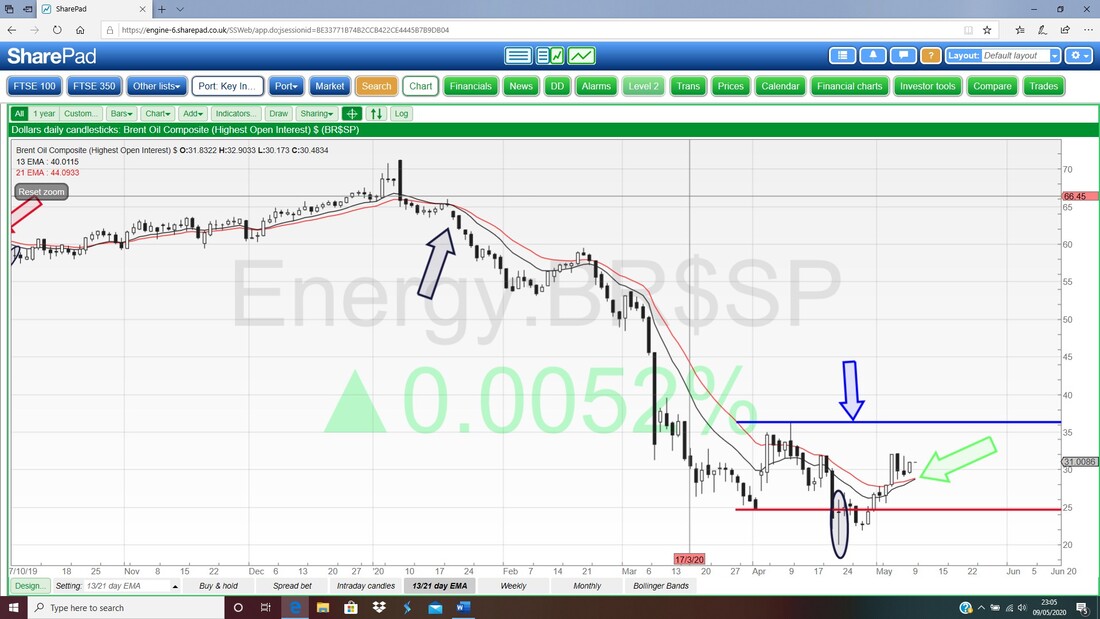
FTSE100
First up the Weekly Candles and there is something very interesting on this one. My Blue Arrow is pointing to a White Up Candle from last week which is in itself Bullish but the most notable bit is that the week before we got a Bearish Shooting Star Candle and this was a bit worrying (if you go back to my ‘Stocks & Markets’ Blog from last weekend then you will see what I wrote about it) but with the gain last week the Bearish Shooting Star has not been able to ‘follow through’. In the strict textbook sense, when you get a Bearish Shooting Star then the next Candlestick should fall from the off and the completed Candle should be below the Bearish Shooting Star. With the gain last week, this has not happened but the Shooting Star is still hanging over this Index and we need a move above the High at 6151 to mean we can stop worrying about the Shooting Star. If I am right about Oil and its impact on the FTSE100, then we could smash through 6151 no worries. 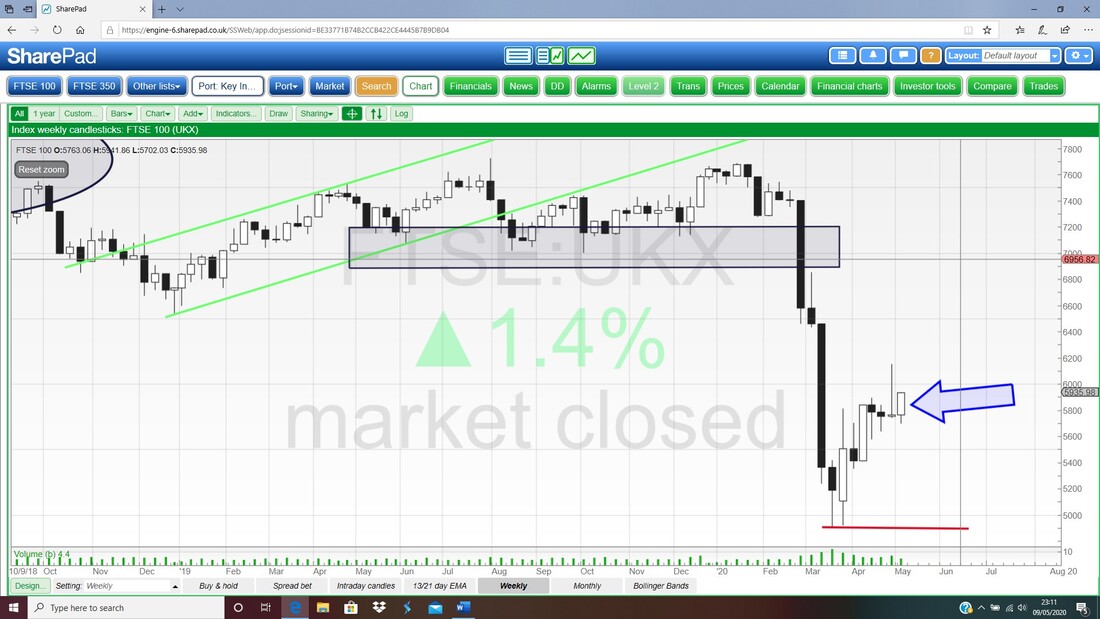
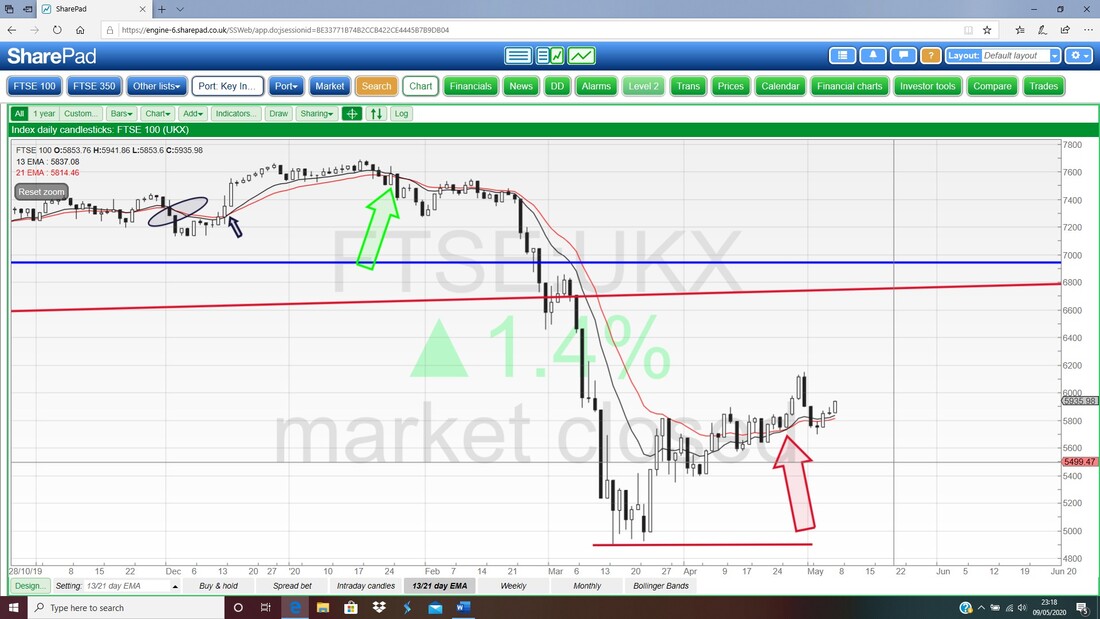
The next Chart has the Daily Candles but I am really focused on the 13 and 21 Day EMA Lines. My Red Arrow is pointing to a Bull Cross and a few days ago it looked a bit touch and go as to whether or not we could build on this but with the strength on Thursday things are starting to look better for Bulls.
In the bottom window on the Screen below we have the RSI for the FTSE100 Daily (Relative Strength Index). There is something really important here that I want to point out and I must remember to do similar on the S&P500 when I get on to that one.
My Black Arrow is pointing to where the FTSE100 RSI is now at RSI 50 which is bang on Neutral and the key thing here is that despite the gains we have had in recent weeks, we are still on a very mild RSI Level and we are nowhere near ‘Overbought’. My hunch is that the Rally will not end until we see an RSI up nearer to 70. We can rise a fair bit before this happens. Something worth understanding is that if an Index just steadily climbs with regular pullbacks, then the RSI can stay at reasonable levels for a long period of time without getting Overbought – we have been seeing exactly this in recent weeks. Things get Overbought fast when a Market just shoots up not when it does this constant wiggling but with an upwards slant. 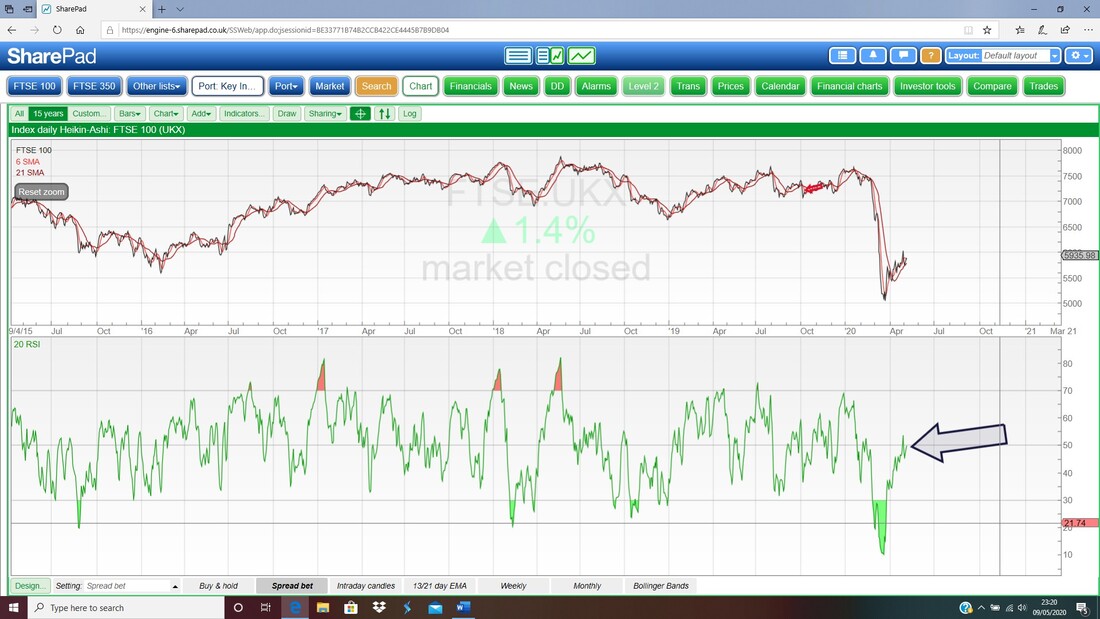
Finally for the FTSE100 we have the Daily Candles and the Pink Zone marks the Upper and Lower Bollinger Bands. My Black Ellipse is marking an Up Candle from Thursday and this looks like it has turned up from the little Doji Candle from Monday. At the Midpoint on the Bollinger Bands, this has room to rise more and bear in mind that the US Markets were very strong on Friday when the UK Market was shut so we could see some catch up which results in a gain.
I have put in a Blue Resistance Line (Blue Arrow) at 6231 which could be troublesome if the FTSE100 can get over 6151 which I mentioned on the Weekly Candles chart earlier. 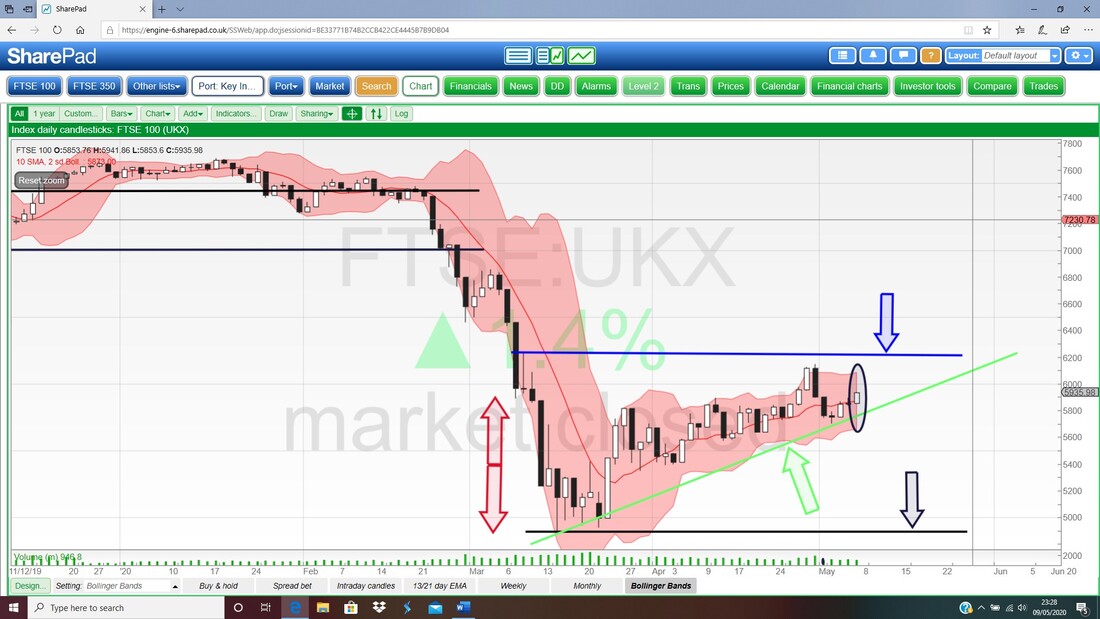
S&P500
Starting with the ‘Big Picture’ first we have the Weekly Candles. My Blue Arrow is pointing to a big White Up Candle for last week and this is Bullish. As I mentioned on the FTSE100, it is particularly interesting because the Bearish Shooting Star from the Week before looks like it has failed with the ‘Follow through’ (you never want one of those, especially after a night on the booze and curry !!), and such a failure is in itself very Bullish. The way to look at this is that yet again the Bears have been presented with an excellent opportunity to take the Markets down but they have failed to deliver the goods and they have felt the Bull’s Horns up their jackseys (as Corporal Jones would say, “They don’t like it up ‘em”). My Red Resistance Line from the Top of the Shooting Star is really important now and the Bulls need to charge through this to keep the momentum going. This is at 2955 and then we have 3000 which is important psychological Resistance. I am Long to a small extent on the S&P500 so I welcome further upside if it can happen. 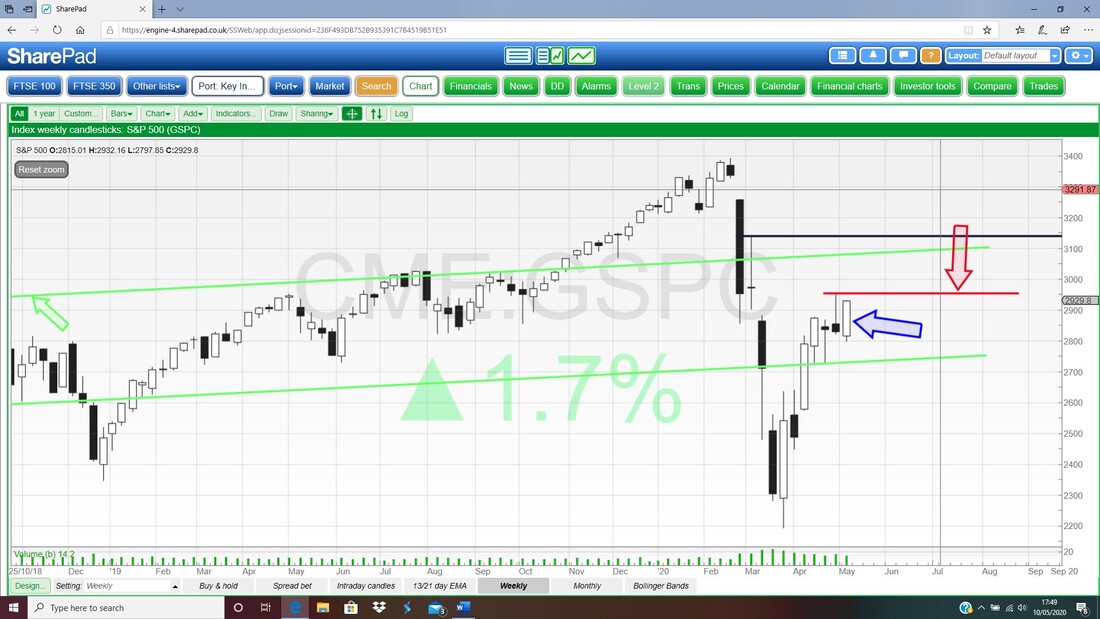
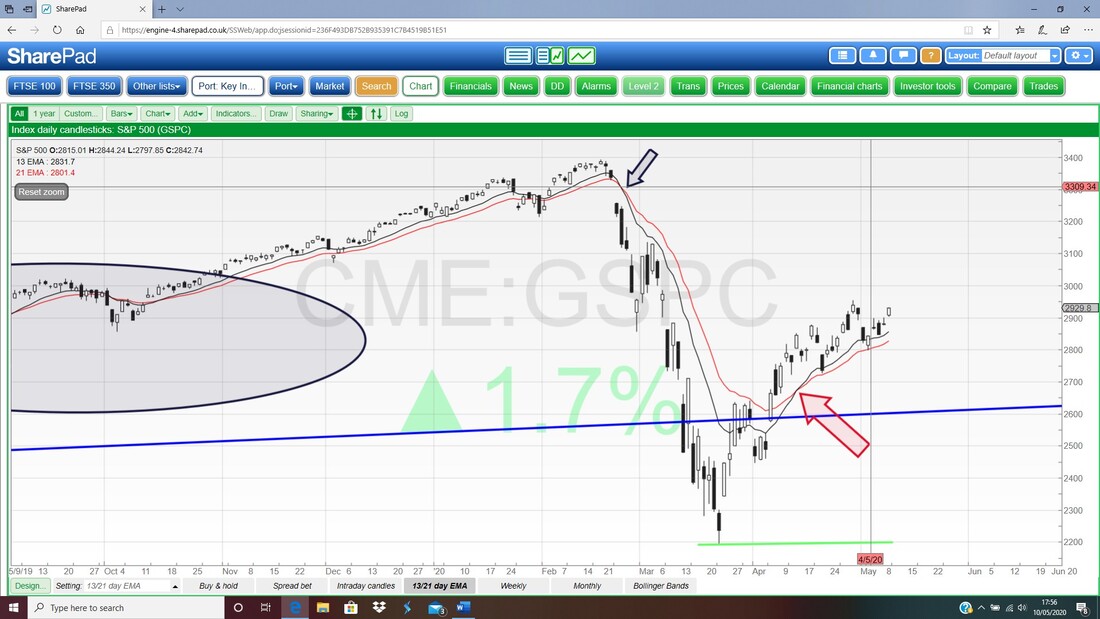
Next we have the 13 and 21 Day EMA Lines – these are looking very lush for the Bulls after a ‘Bull Cross’ where my Red Arrow is and the Lines are moving apart which shows the strength of the push up. It also means that we can have a Pullback for several days without changing the overall Bullish picture. Sweet.
I don’t normally show the MACD on the Charts because although I do often look quickly at it, I do not find it a particularly reliable Indicator and it moves too fast really. However, there is a Learning Point here and for that reason I have included it this week.
If you look in the bottom window on the Chart below, we have the MACD (Moving Average Convergence Divergence) for the S&P500 Daily and something interesting and Bullish has happened here. My Black Arrow is pointing to what we call a ‘Glance-off’ or ‘Skim-off’ which is where the MACD was heading towards Bearish (look at the shape of the Green MACD ‘Hump’ over the last few weeks) and at the last moment, it has glanced off and avoided this Bearish scenario. Such Bearish avoidance is Bullish. 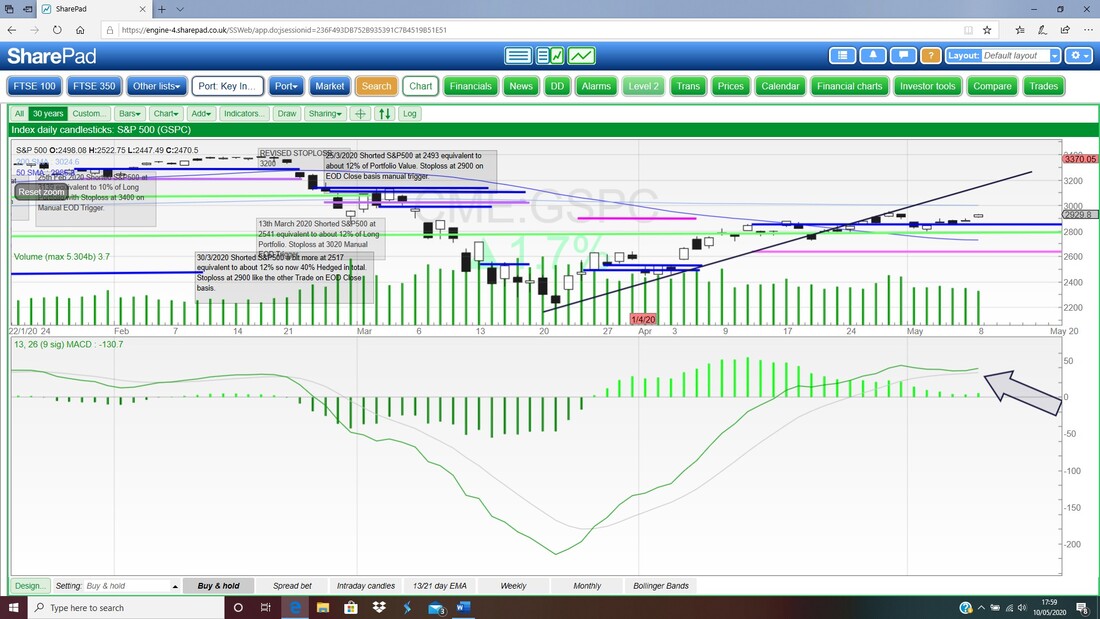
In the bottom window on the next Chart we have the Daily RSI for the S&P500. On a Reading of RSI 56 this is still barely much above the Neutral 50 Level and it is pretty amazing how with such a strong move up we have not had high RSI Readings. As I keep saying, I doubt this Bull Run ends until we see RSI Readings up around 70 or more.
With a steady Uptrend Channel which has lots of Pullbacks, the RSI can stay reasonable for a long time without getting Overbought. 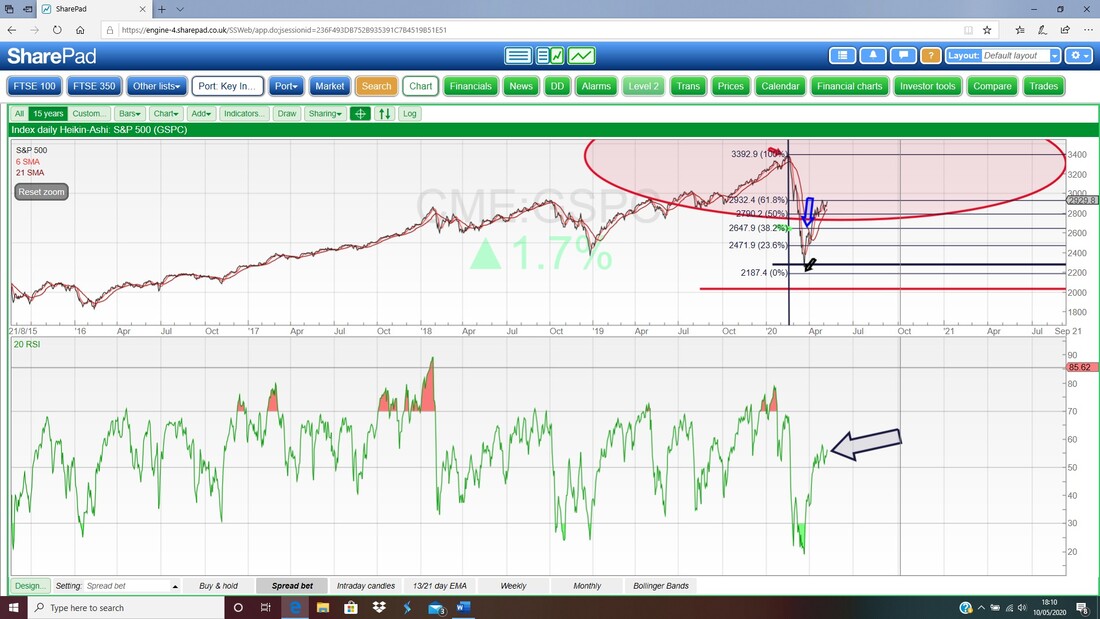
And last of all we have the Daily Candles with the Pink Zones marking the Bollie Bands for the S&P500. My Black Arrow is pointing to an Up Candle from Friday and it is quite near the Top Bollinger Band. As I mentioned on the Weekly, the key here is to get through 2955 and if it can manage that, it is Bullish.
OK, that’s it for this weekend. Make sure you endure the Podcast and if you ‘Subscribe’ (don’t worry, it is Free !!) then you will get Notifications when the new episodes come out. Good Luck y’all, WD. 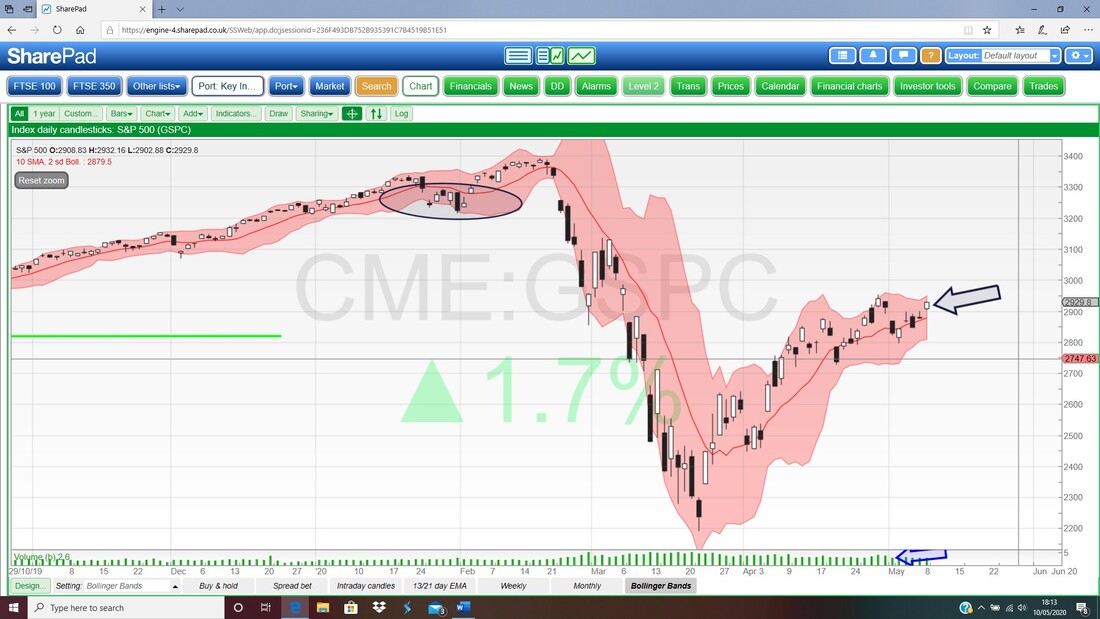
2 Comments
Ann Droid
5/11/2020 01:31:44 am
John Burford over at his site is still maintaing that the FTSE top is in, it goes no higher than 6151 and the bear market resumes.
WheelieDealer
5/17/2020 03:09:53 pm
Hi Ann, Leave a Reply. |

Stocks & Markets WheelieBlogsThese tend to be more Markets and Stocks related and timely - the Blog Page on the Main WheelieDealer Website has the 'Educational' stuff (well that's the theory anyway !!). Archives
October 2021
Categories
All
|
