

|
stocks & Markets blog |
|
I am starting this on Saturday Night and earlier today I went out for nearly 2 hours for a long roll down to Windsor Marina to take advantage of the much improved weather. It is so long since I had any kind of exercise and Lockdown seems to essentially revolve around eating (if I am not thinking about what I will eat or drink next, I am actually consuming something) and it struck me that my cardiovascular system really is crying out for a bit of use.
On the way back I bumped into Ewan Hughes (@EwanHughes7) who lives just around the corner from me and he came to the WheelieBash last summer, and it was excellent to see him again and to catch up on his latest Trading/Investing exploits. I was particularly pleased when he told me he had been out earlier and was walking around Eton and listening to our latest Podcast TPI 43, which he was streaming from Spotify using 4g. My goodness this modern tech stuff is pretty amazing.
On that subject, you can hear the latest Podcast at the link below on Soundcloud and if you use Apple, Spotify, YouTube, Audioboom, Overcast, Google+ and probably many other Platforms, then go to the ‘Conkers Corner’ Channel and you should find all the Podcasts there (and some excellent interviews that C3 has amassed over the years), and you want TPI 43 for the latest effort.
As usual, this one covers our thoughts on where the Markets are now and what we think is most likely going to confront us in coming months and what our strategies are, and we discuss loads of Stocks and there is oooodles of Educational stuff just weaved into the discussion or more directly addressed, as is the impact of Storytelling on our Brains in this one: https://soundcloud.com/user-479955511/conkers3-wheeliedealer-43-growth-vs-value-gme-ark-lloy-btc-cmlf-slp-smt-bnzl-beg-saga Last Week Well it all turned out a bit ropey. My Portfolio ended up losing 3% on the week and I am pleased to still just about be hanging on to positive territory for the year so far. As I mentioned on the Podcast, I am not expecting a huge drop or anything but of course we might get a bit more weakness; particularly because so much is clearly crazily over-valued and there are Bubbles all over the place. In my experience, we only seem to get the really nasty and painful drops when there is Economic slowdown on the immediate horizon and that is certainly not the case now; if anything, Economies around the world are recovering and the outlook is improving as Covid19 gets beaten back with Vaccines and better treatments and a healthy realization that carrying on with Lockdown is far more damaging than the impacts of the Virus. On this basis my Strategy stays the same and I am 100% Invested and just carefully tracking the Indexes for signs I might need to Hedge. Because I don’t expect a huge and painful drop, I am not Hedged at the moment but I am staying highly alert to any such need. After all, I am often wrong and I could be totally wrong about this; but if I am, then the Charts will tell me. On the valuation side of things, I am not too concerned because on the whole I think I hold a lot of Stocks that are actually undervalued and where there is considerable upside over time. I hold a small number that are on meaty valuations, like BOO, TM17, TSTL, WATR, PYPL but I can live with those because they are all growing well and I have a nicely diversified Portfolio so I can take some risk. The ability and willingness to Hedge also removes a lot of worries about whether or not Markets are over-valued. With the Markets a bit wobbly, I am preserving my Cash but if things calm down, then I will be looking to spend some in my Income Portfolio and as I mentioned before many times, I fancy some SUPR and maybe this will happen in March, if things come together as I would like (oh, and I want to buy some new Wheels for my MX5 so I need Cash for that !!!). So with the spanking last week, I think any gains I had on the board for February evaporated and I am pretty much back where I was at the end of January. Quite frustrating but that is how it goes and I am expecting that I can add some gains in coming months – but as always it is bound to be up and down along the road. I actually had a look at my Income Portfolio Account the other day and was sad to see it was down a little bit on 2021 so far – barely anything, about £300. Since that it has dropped more with the hit on Friday in particular, so I need it to get doing its job – but of course we have 10 months to go before December 31st !! Blog Slate Sadly there is not much to report here. Well, that’s a total lie really – the truth is I have done nothing to push the Blogs forwards and I am still having aggravation with my health challenges. I saw my GP a couple of weeks ago and have been expecting a letter from Stoke Mandeville Hospital to get things moving. Sadly, I got the letter yesterday and unbelievably they are talking about a ‘Telephone Appointment’ on 15th March. Apart from the delay, the fact it is just a phone chat is immensely frustrating and will achieve nothing so I am most likely going to call my GP on Monday and vent my spleen !! (hey, maybe it is my spleen that’s knackered……). Anyway, I need to update the ‘Monthly Performance’ page for February and that is quite easy so I should manage that next week. And I mustn’t forget that I did update the ‘Little Black Book’ which is on WD2 and that has loads of Stock Ideas where I think they could be good but you need to dig into them properly and make your own decisions. From Sunnier Times No doubt most Readers know by now that all the Blogs I have scribbled can be found listed on the ‘Blog Index List’ page on WD2. All the Educational ones have Links and the newer ones are fully linked up. From that Archive, I bring you this old hound which you might find interesting when it is raining and you have nothing better to do…… https://wheeliedealer.weebly.com/educational-blogs/aga-and-mlin-is-pension-deficit-thinking-in-deficit This is quite interesting. I was chatting with my mate Zyg (@ZJS_Ret) on the dog and bone yesterday and the subject of Pension Deficits came up (I can’t even remember which Stock we were referring to) and so this old Blog is very pertinent to me. It is also interesting because in fact AGA turned out a turkey but on the flipside, MLIN evolved into MPAC and has been a massive winner for me (with more to come I think) – and made me masses more than the loss I took on AGA. Funny old game…….. Alright, alright, I know you want the pretty pictures….. S&P500 As is ever thus, all the Charts I show are screen-grabs from the superlative SharePad software that I use and if you fancy it yourself, then please look around my websites where you should find SharePad ‘adverts’ that you can click on and that takes you through to where you can sign up and get 1 month of FREE Data and I get a drink out of it as well – thank you hugely !! I am certain there is one on the Homepage. If you click on the images of the Charts, then they should get bigger on your screen so you can see the detail a bit better. I recommend you do this using a ‘big’ screen rather than your Fone – a Tablet is probably ok but it must be a nightmare on a tiny Fone display (and you only have the one pair of eyes, as your Granny keeps reminding you). I am particularly fascinated in how the Monthly Candlesticks ended up for February; when I looked at them last weekend there were some worrying hints and now they are complete (and therefore actually valid for analysis purposes), they might have some useful signals for us. So below we have the Monthly Candles for the S&P500 – this is not looking too good. My Blue Arrow is pointing to an ‘Inverted Hammer’ or ‘Bearish Shooting Star’ or whatever purists wish to call it. Anyway, the fact is it looks like a warning that Markets want to drop and this is especially the case following on from the Doji Candle for January which was already hinting at trouble ahead. If this Bearish Candle is predictive, it doesn’t necessarily mean a big collapse is coming (I doubt that very much) but it could mean weakness and perhaps just a lot of sideways grinding for a while. Summers are often like this so it sort of would make sense. In addition, weakness around March/April is highly normal and fits the usual seasonal pattern. 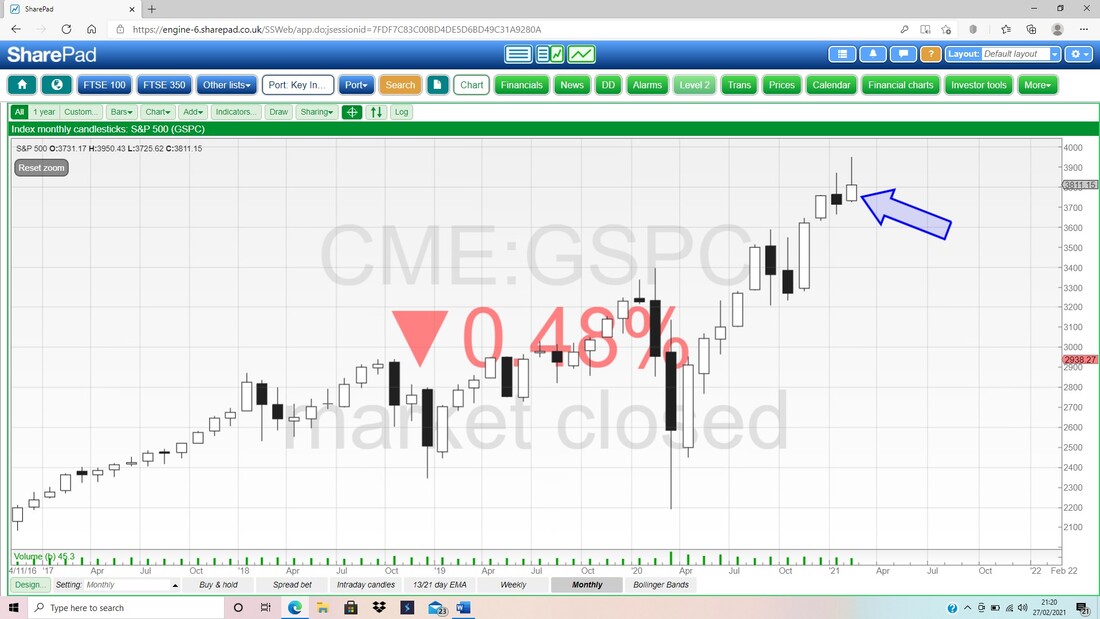
In the bottom window on my next Screen, we have the RSI (Relative Strength Index) for the S&P500 Daily and where my Black Arrow is we are on a reading of RSI 50. This is bang on Neutral and means it is not over-bought or over-sold; so in effect it can go anywhere it likes !!
It wouldn’t surprise me if we bounce a bit and that would not be inconsistent with the Bearish Monthly Candle. Remember, a longer timeframe is made up of lots of smaller wiggles in shorter timeframes. 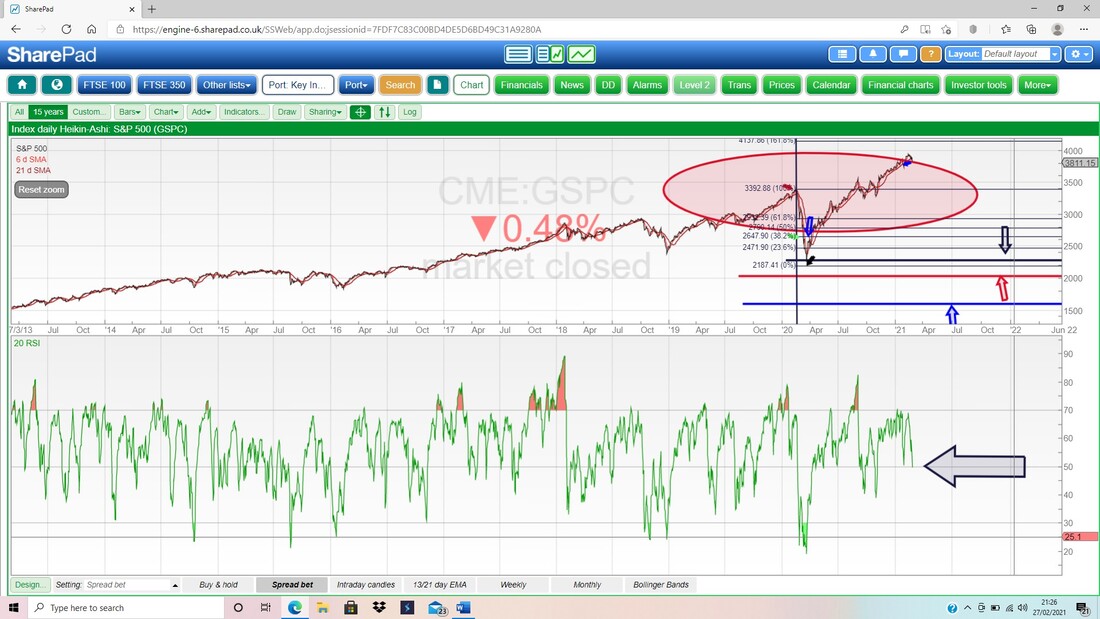
Next the Weekly Candelabra for the S&P500. The interesting thing here is that Uptrend Channel marked by my Black Line (Black Arrows); and at the moment the S&P500 is testing the Lower Support Line. My Blue Arrow is pointing at a Down Candle from last week and we need it to turn up soon to stay in that Uptrend Channel.
If it does fall out of the Channel, then there is Support at about 3662 and down to 3600 in particular, and then down to 3200. 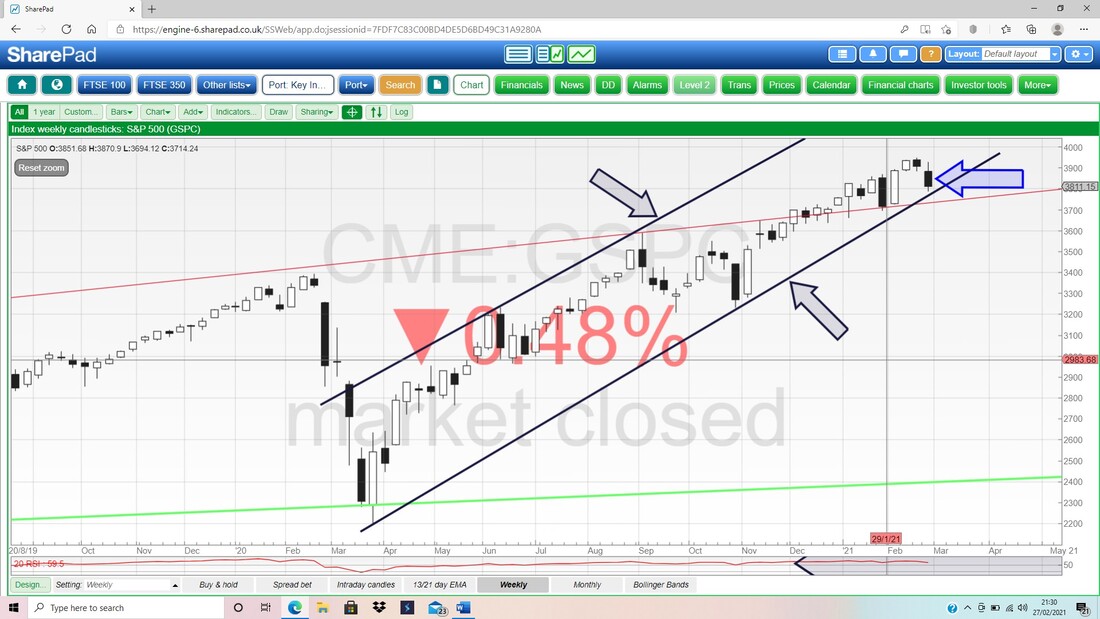
Next one of the most useful and reliable Signals there is (it is only not so good when a Market is going sideways and chopping about). My Blue Arrow in the top right-hand corner is pointing to where the Black Wiggly 13 Day EMA Line (Exponential Moving Average) is very near doing a ‘Bear Cross’ with the Red 21 Day EMA Line.
If it does do a Bear Cross, then that would imply weeks of softness ahead but we need to be careful of Crosses (both Bear and Bull ones) which crossover but then quickly reverse – so the best trick it to give them a few days to ‘cement’. Hopefully we can dodge a Bear Cross but if it happens, this might be a good Index to Short. 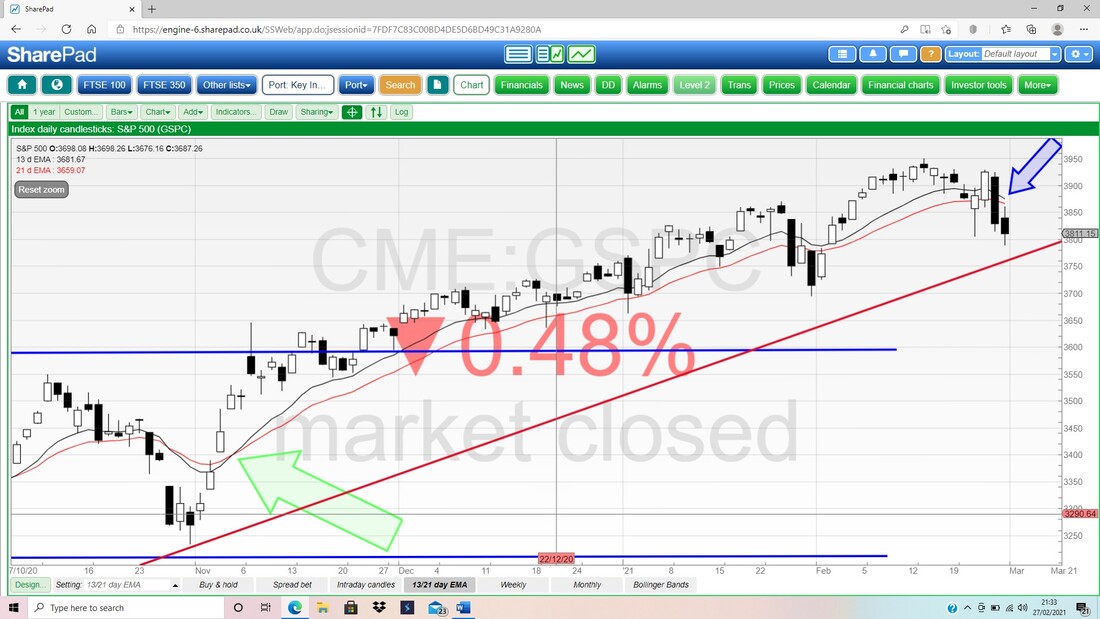
Last up for the S&P500, the Daily Candles with the Pink Splodge marking the Upper and Lower Bollinger Bands. My Blue Arrow is pointing to a Doji Candle from Friday and this is pretty much down at the Bottom Band so there is a likelihood it tries to move up from here. That might just be a shorter-term bounce and again this is not inconsistent with the Bearish Monthly Candle.
My Green Ellipse is marking a wide Zone of Support in case we do get more weakness. 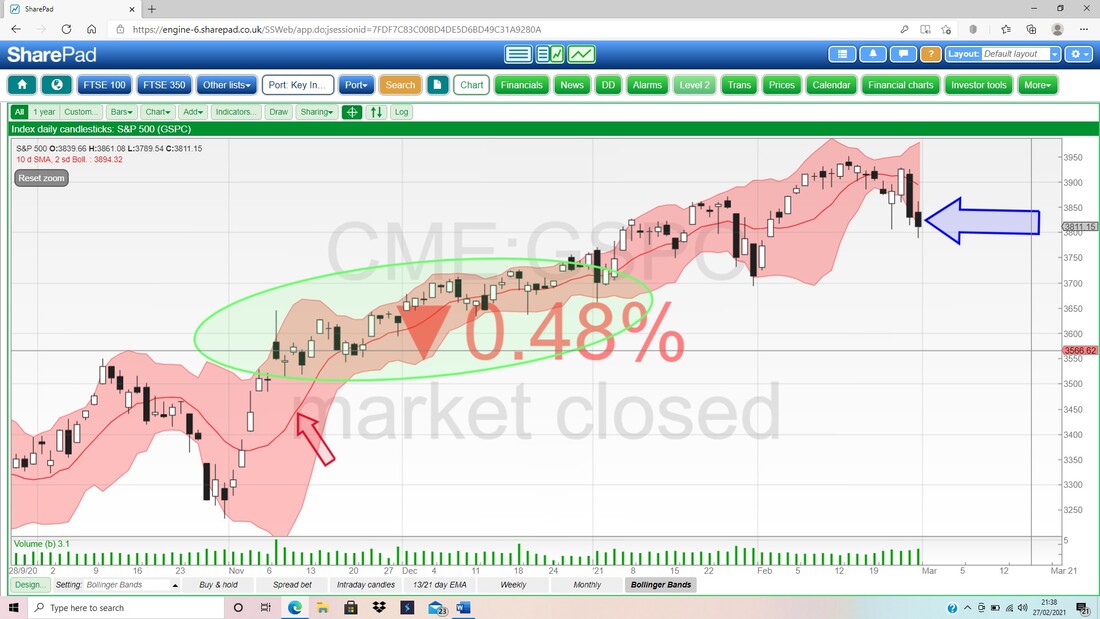
Nasdaq Composite
I won’t spend ages on this but below we have the Monthly Candles for the Nasdaq Comp and again this looks horrible. My Red Ellipse is encapsulating the Candle for February and this looks much more ugly than that on the S&P500 and is a clear ‘Bearish Shooting Star’. It shouldn’t surprise anyone when you think of the run up that US Tech Stocks have had and the valuations are eye-watering in many cases. 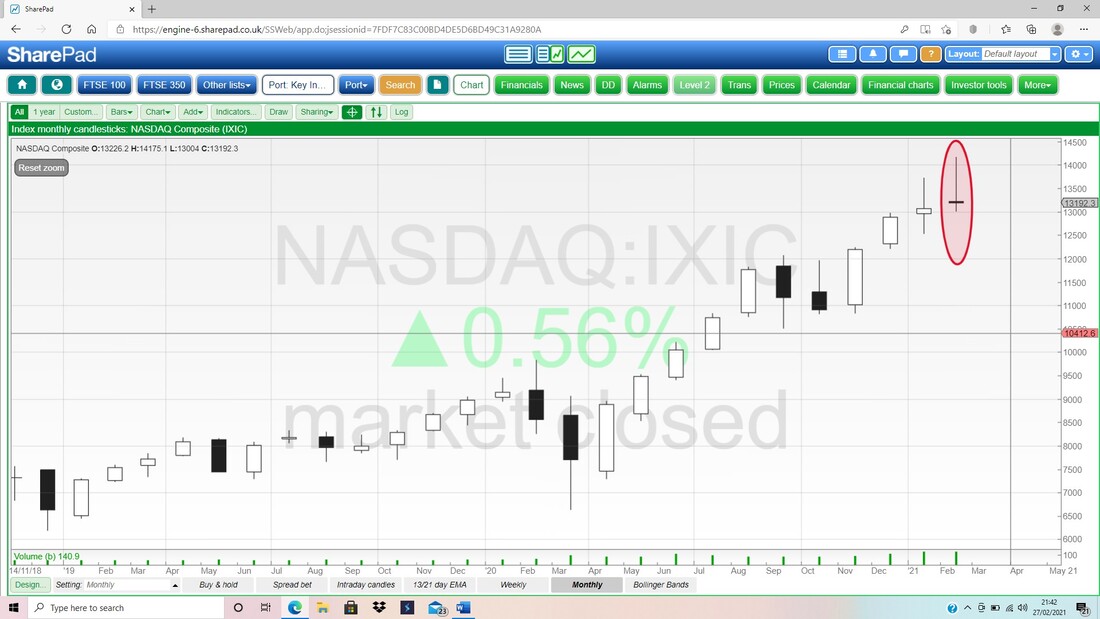
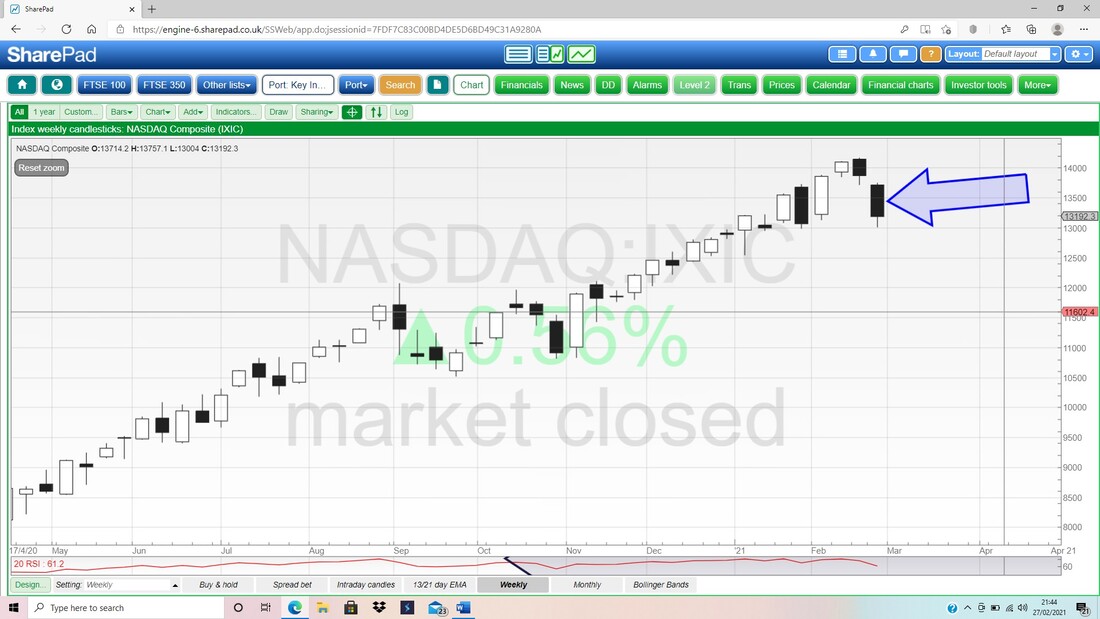
Next up the Weekly for the Nasdaq Comp. My Blue Arrow is pointing to a big Black Down Candle from last week and that is clearly Bearish. There is Support down at about 12500 and then to 12000 and then a Zone down to about 10500.
Finally, for the Nasdaq Comp we have the Daily Candles with the Bollingers. My Blue Arrow is pointing to a ‘Long Tails Doji’ from Friday and note how this found Support bang on the bottom Bollinger Band. It might try to move up from here but I get a sense that there is weakness afoot in the Nasdaq………
The immediate Support is at 13000 and if that fails, then we will most likely see more falls. 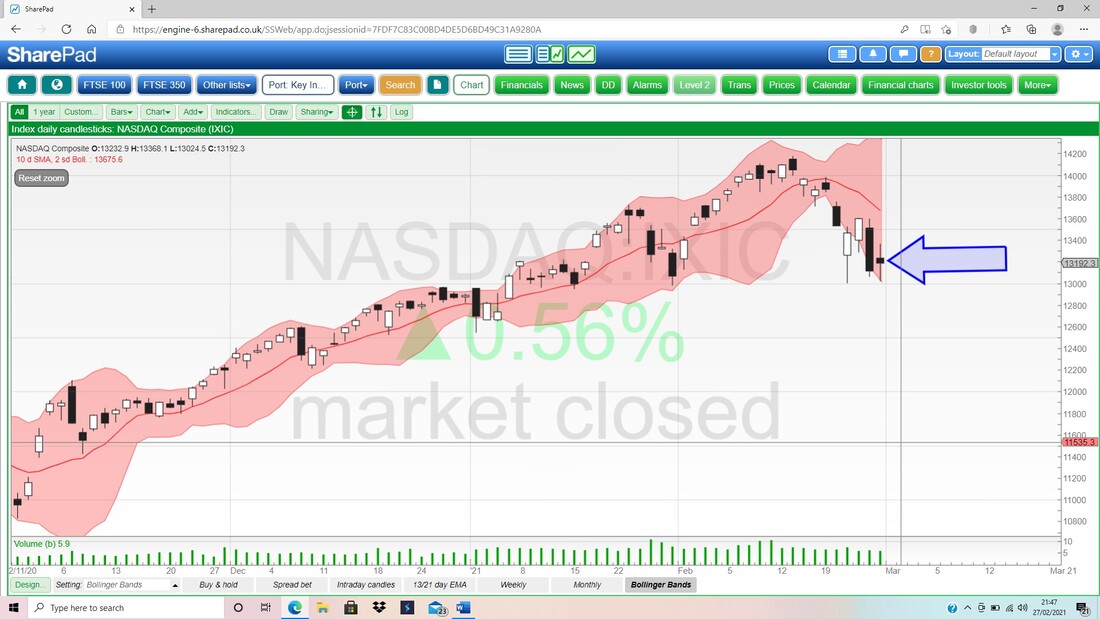
Brent Oil Composite
This is nice to see anyway. My Blue Arrow is pointing to a Big White Up Candle for February on the Monthly for Brent Oil Comp and this looks Bullish. There is clearly Resistance up around $75 and then up to about $87. Hopefully this can play out well and give the FTSE100 some Support. 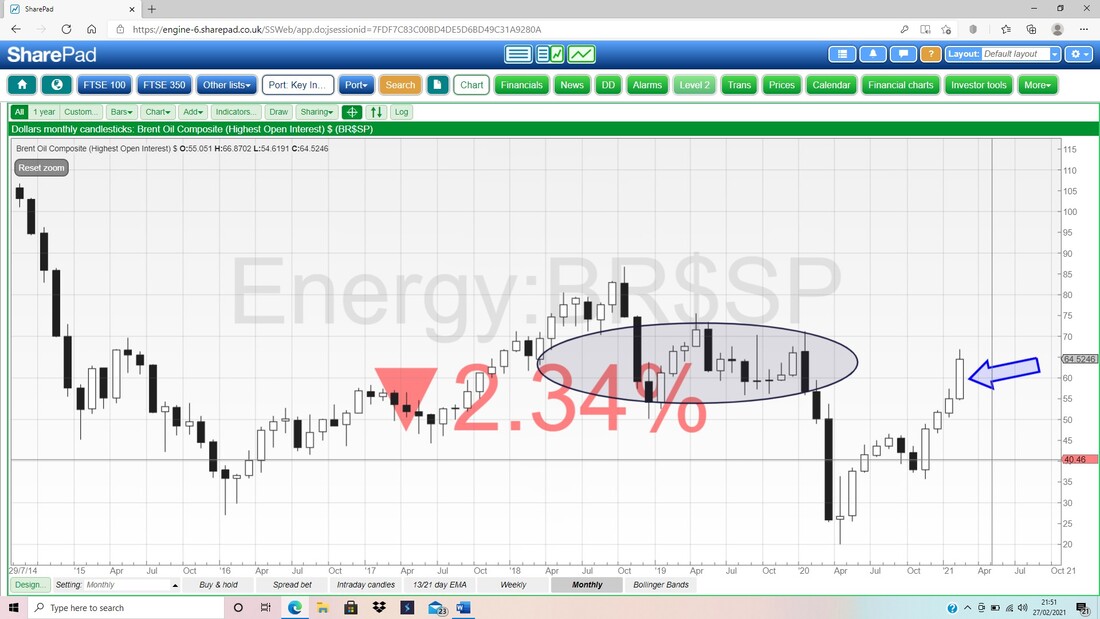
Next we have the Daily Candles for Brent Oil Comp and my Blue Arrow is pointing to a Big Down Candle from Friday. Note how it parked itself on the Red Bollinger Midpoint Line (Red Arrow) and this could be Support from here.
The Bottom Band is down at about $61 and this should be Support. 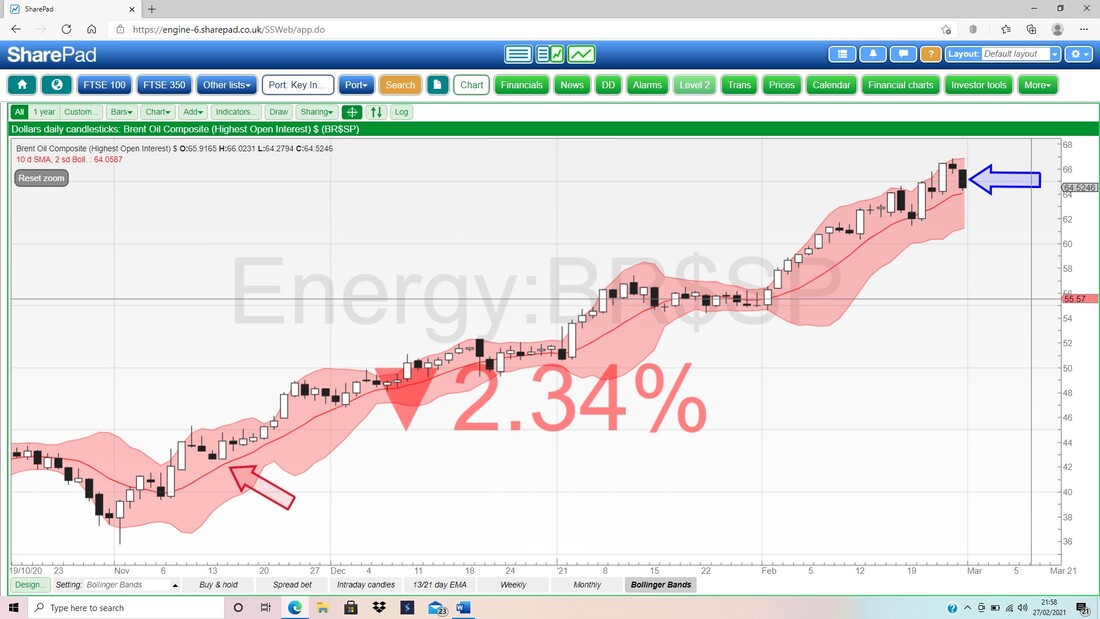
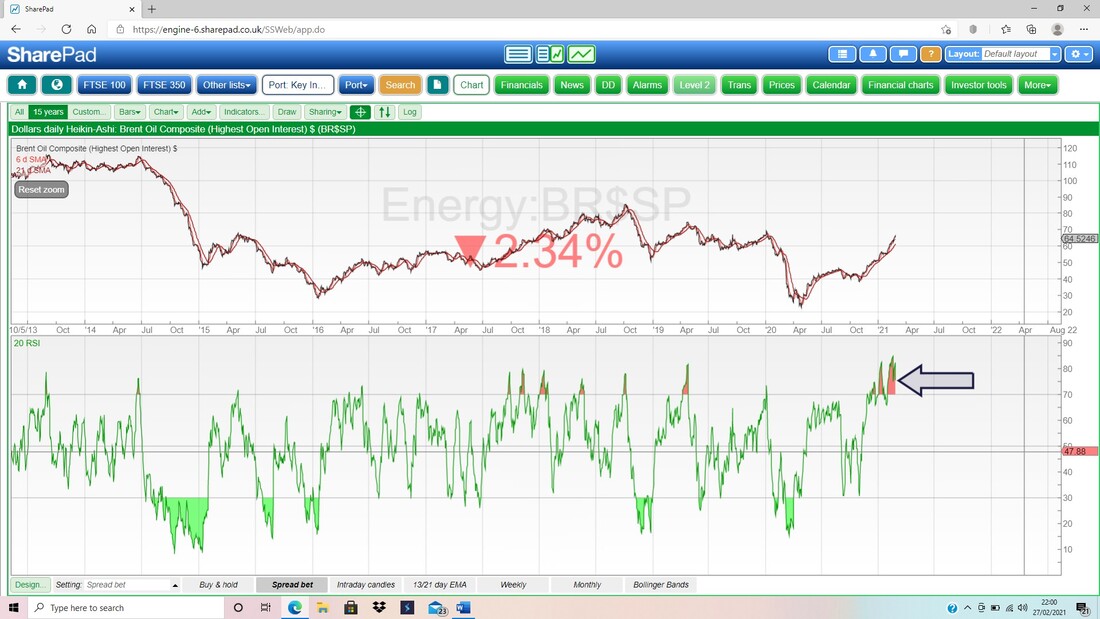
In the bottom window below we have the RSI for Brent Oil Comp Daily. Where my Black Arrow is we are on a Reading of RSI 75 and that is very over-bought; so some sort of pullback or sideways movement is needed to calm things down.
FTSE100
Of course the first one I want to look at is the Monthly Candles. My Red Arrow below is pointing to a grotty looking ‘Bearish Shooting Star’ for February and after a similar Candle for January, it doesn’t look too promising. 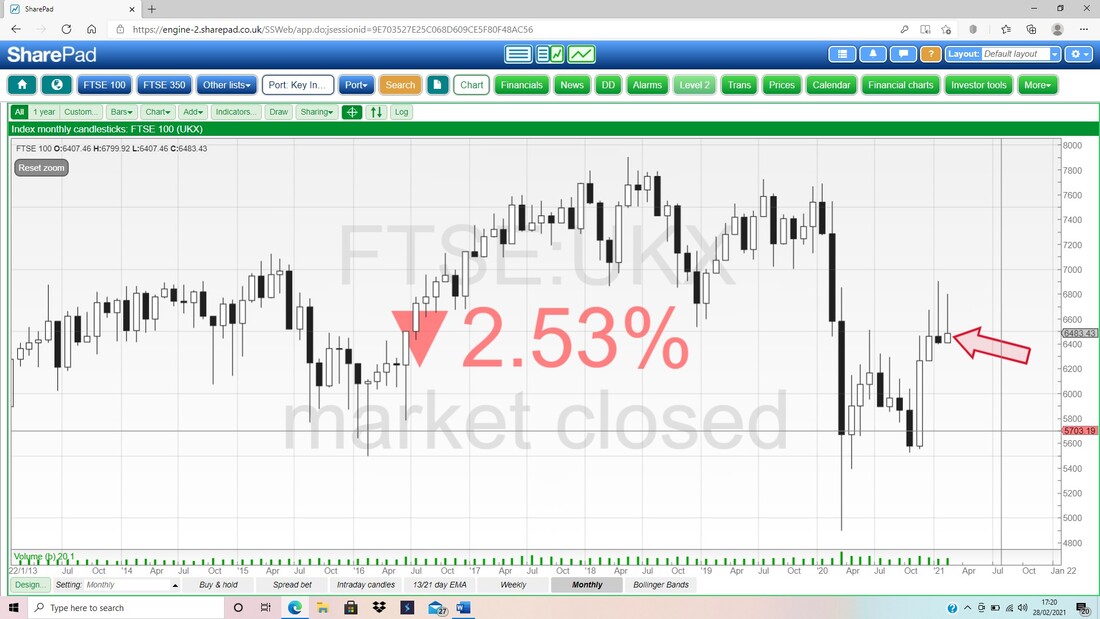
Next up the Weekly for the FTSE100 and it doesn’t look too promising either. My Blue Arrow is pointing to a Down Candle for last week and this is turning down off a Bearish Shooting Star from the week before.
Next Support is around 6400 and then 6315, 6263 and down to 6000. To the upside, we need a Breakout over 6903 where my Green Arrow is. The Zone marked by my Black Ellipse should be decent Support. 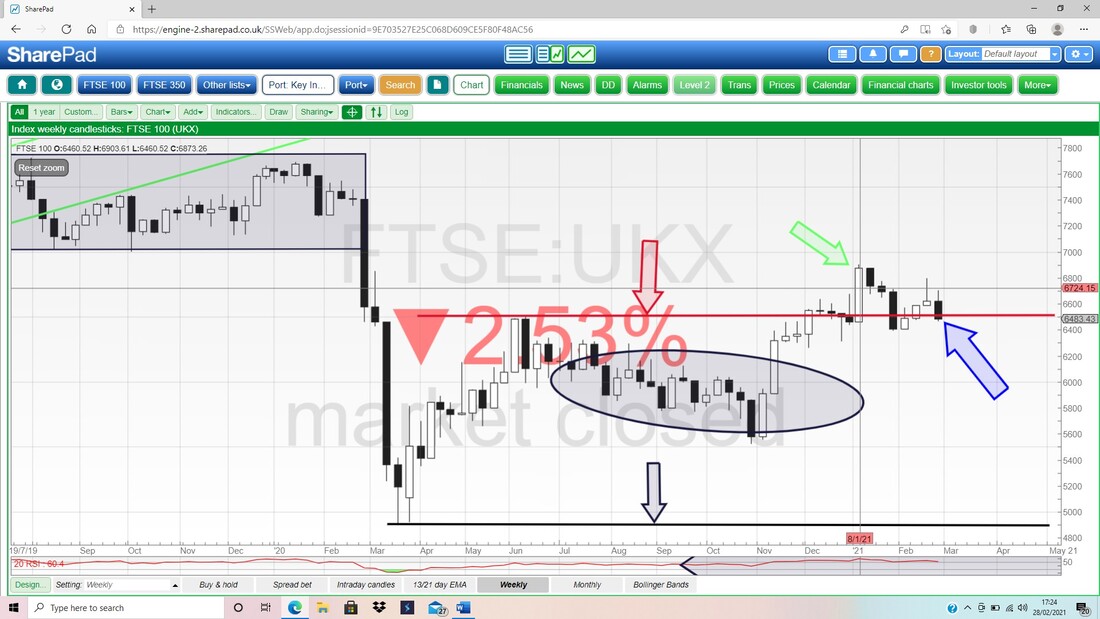
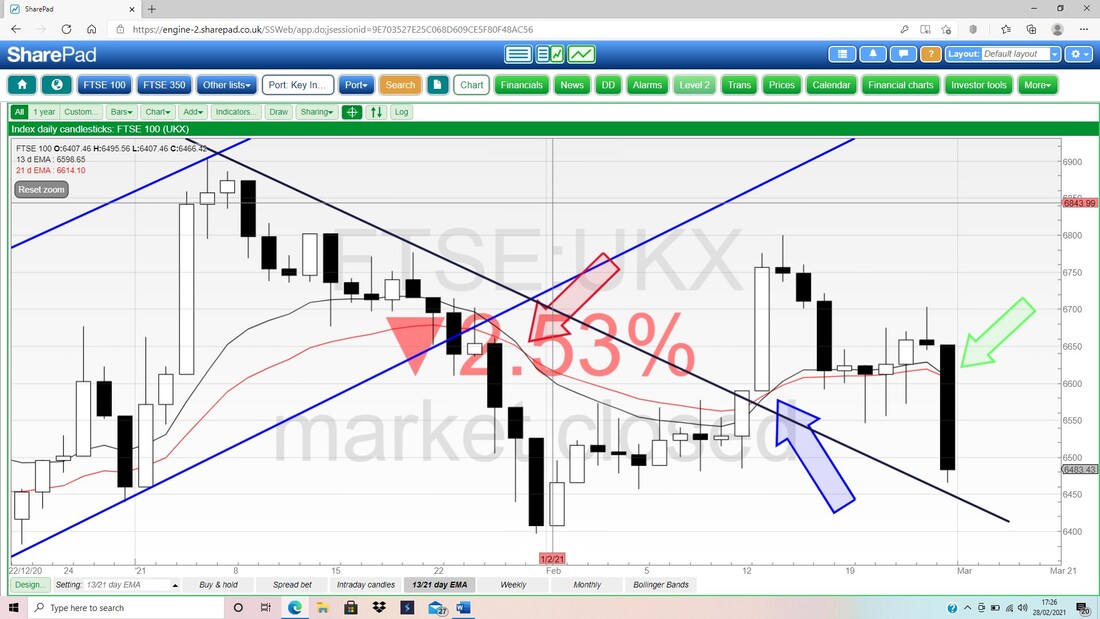
Next I am focused on the 13 and 21 Day EMAs and my Green Arrow is pointing to a potential ‘Bear Cross’ where the Black 13 Day EMA crosses the Red 21 Day EMA from above. This is problematic although you can get ‘False’ Signals when a Market is choppy and sideways. We really need a couple of days or so to cement this Bear Cross.
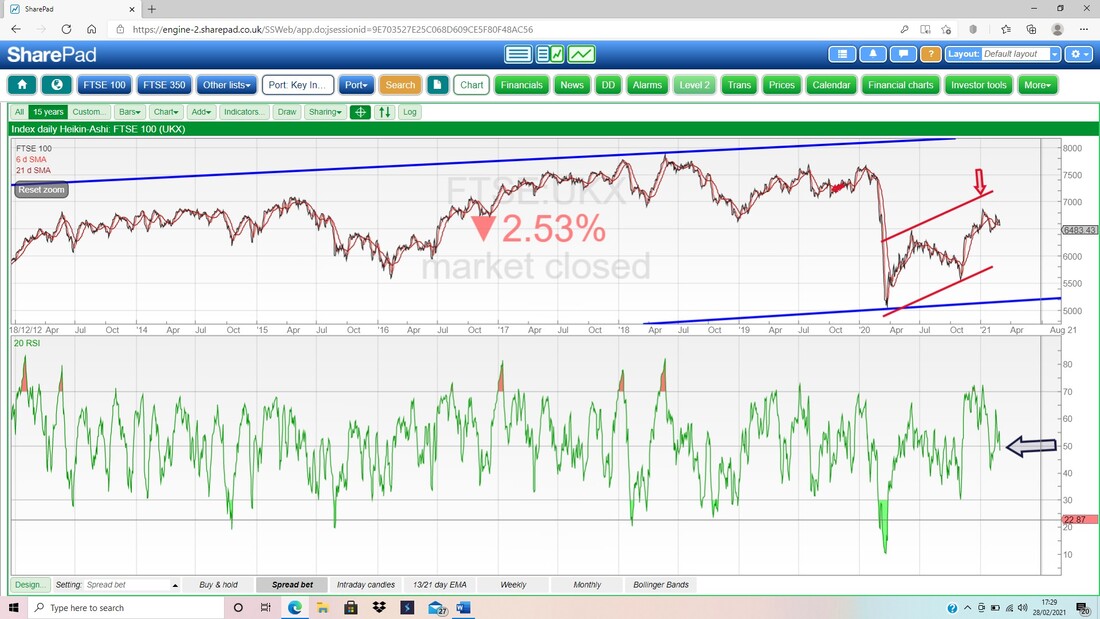
On my next Screen in the bottom window we have the RSI for the Daily FTSE100. On a Reading of RSI 48 where my Black Arrow is, this is around the Neutral level.
Finally for the FTSE100 we have the Daily Candles with the Pink Zone marking the Upper and Lower Bollinger Bands. My Blue Arrow is pointing to a Big Down Candle from Friday and note how this Closed bang on the Bottom Band. There is a good chance it can bounce a bit, especially as Friday was the last day of month, but the earlier Charts suggests there is a whiff of Bear in the woods and you know what Bears do in the woods……..
I suspect we get some sort of attempt to move up but we need to watch that Red Bollinger Midpoint Line at about 6650 (Red Arrow), that may cap any upside. 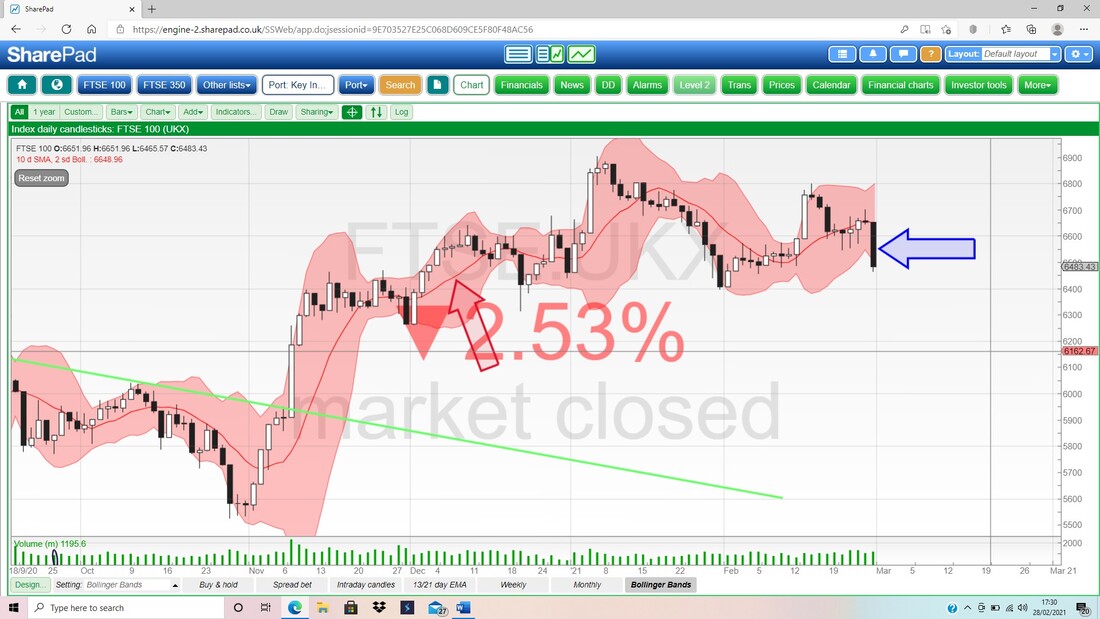
FTSE250
I want to knock this blog on the head now, but here is the Monthly Chart for the FTSE250 and it doesn’t look as bad as the others. My Red Ellipse is capturing the Candle for February and clearly it fell from the High, but it is not as nasty as a Bearish Shooting Star or a clear Inverted Hammer shape. However, if the bigger Indexes drop then it will be difficult for the FTSE250 to escape. 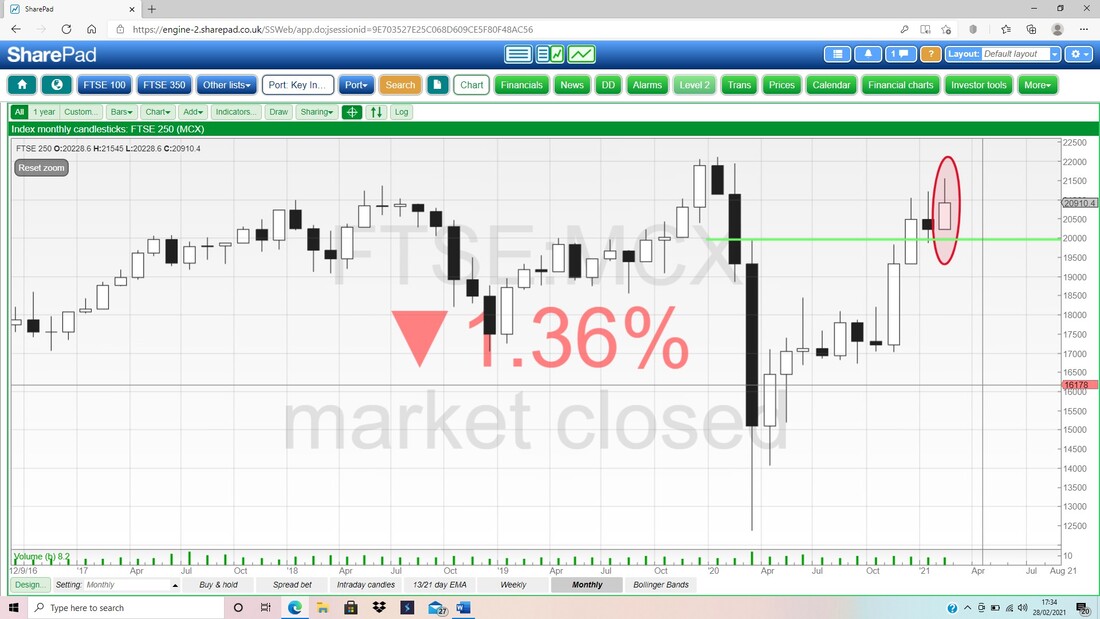
I was trying to end the blog but the Weekly on the FTSE250 is interesting. My Blue Arrow is pointing to a Bearish Shooting Star sort of shape and this comes after one the week before as well. This is weak looking and suggests downside, but note the Parallel Green Lines that mark an Uptrend Channel and as long as the bottom Support Line holds, then the FTSE250 may get off lightly.
OK, that’s it for this week. Be careful because things most definitely look a little more challenging…….. Cheers, WD. 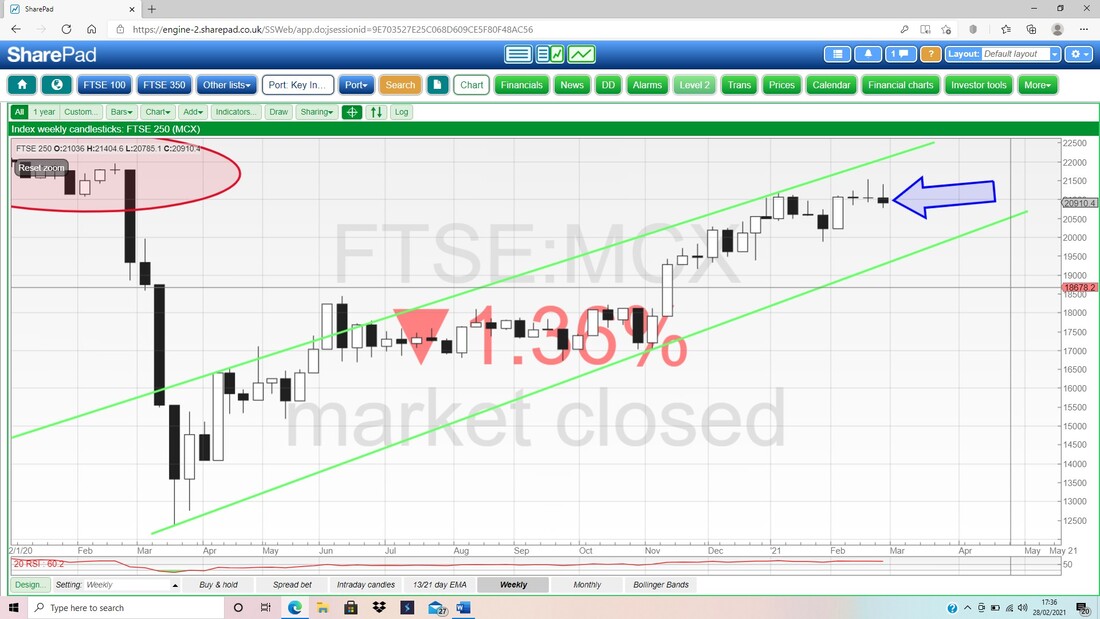
0 Comments
Leave a Reply. |

Stocks & Markets WheelieBlogsThese tend to be more Markets and Stocks related and timely - the Blog Page on the Main WheelieDealer Website has the 'Educational' stuff (well that's the theory anyway !!). Archives
October 2021
Categories
All
|
