

|
stocks & Markets blog |
|
So Monday in particular and then the remains of the Week, turned out to be pretty momentous with both the fundamental news of a potential Vaccine and the Biden win (most likely tempered by the Republicans keeping control of the Senate), but also from a technical viewpoint the Markets have done some pretty significant stuff which I will come onto later in the Charts bit.
I got caught out on Monday and this hurt my returns for the week, although I didn’t really do much ‘wrong’ that I can actually fix as such. If anything, my only error was in having a FTSE100 Short Hedge which was too large and I should have kept it more in line with the level of Long Exposure I had in my Spreadbet Portfolio; in reality it was probably about 50% higher than the ideal.
It’s a difficult one and Hindsight Bias is not helping here at all. As we finished Friday night before the weekend, I was happy to be 50% Short because at that point we did not know the outcome of the Presidential Election and I wanted to be Hedged against potential trouble; and if you read my Charts Blog last Sunday, then clearly the Technical were supportive of the most likely move being downwards.
As it happens, I looked at my ADVFN App at about 8.15am on Monday Morning shortly after I woke up, and the FTSE100 was up about 1% or a bit less – and of course at that point the news about the Vaccine had not hit. I then got on with reading the RNS Announcements and stuff and then I remember settling down for a snooze and at that point my Stocks were looking good and I was happy with the stance. Then I had the shock of my life when my mate Zyg @ZJS_Ret had sent me a TXT which said something like “The FTSE is going nuts”, so I dived onto the ADVFN App and saw the FTSE was up 5% and thought, “Sh*t I need to reduce those Shorts pronto !!” and I opened up the igIndex App and Closed more than 50% of my Short Position. I then knew any more craziness and my Positioning wouldn’t cause me trouble (if Shorts are way bigger than Longs and the Markets shoots up, the ‘Cash Available’ in the Spreadbet Account gets munched fast, and already my Cash had taken a battering). I utterly detest making quick snap decisions intraday, but experience has taught me that the stress of not doing anything when your balance is so bad can really drive you crackers. I am far happier to reduce the Risk to the point where it will not be a problem, and then I can relax and let the Markets do their thing through the day. Then in the Evening after Markets are shut I can assess the situation and take action as required. If you look at my ‘Trades’ page, and if you read my Tweets from the time, then you can see this is precisely what I did. I am frustrated that a nice Paper Profit showing on my FTSE100 Shorts was quickly reversed into a Loss situation that I had to realise, but on the other hand I am pleased that I have been strict and disciplined and taken action. It has been a huge failing of mine in past years to not take the required action to cut Losses in such situations, and I am pleased with how I dealt with both the Trades and the situation. Hindsight Bias is crucial here though and when looking back and trying to see what could have been done better, this needs to be properly understood. As we went into Monday Morning, with the uncertainties that prevailed and the negative outlook of the Charts, I was most definitely right to be Hedged. The areas where I could do better are no doubt about the size of the Hedge – maybe after the initial force of the moves down, once we got the rebound I could have reduced the size of the Shorts – although at the time the picture was still very much bearish and we did not know what the outcome of the Election would be. We also need to consider the counterfactual – if the Markets had tanked then I would have looked pretty shrewd. It will teach me not to have a snooze in the morning, but for goodness sake, when else am I supposed to sleep? Anyway, it is something for me to ponder and the only obviously ‘fix’ is rather than being 50% Hedged, I might be better to stick to 40%. We shall see. Last Week Despite struggling early in the week with the Shorts, I managed to squeeze out a gain of 1% for the week and now my Portfolio is up 3% Year to Date since January 1st 2020 – I have to pinch myself to actually believe I am up when you consider the truly momentous Economic, Political and Social History that is being written. What is also extremely pleasing is that I have now had a run of 9 weeks of gains with only 1 down week in that period – it has certainly helped the overall performance. In addition, because I have kept my Portfolio of Stocks pretty much the same all through 2020, I have exposure to both the Stocks that have done well in the Lockdown period, but also I still have plenty of Stocks with a Cyclical bent which should do well on the rebound. I might tinker a little bit around the edges in coming months but I am most likely to just let things play out. People who went all in on Lockdown Stocks must now be suffering angst about whether or not to switch back to Cyclicals. Because the FTSE100 had bounced so much, I thought it might have helped my Income Portfolio (see the ‘Portfolios’ page on WD1 to see exactly what I hold) so I logged in to check the current value. At the time of typing this, the Income Portfolio is down 6.7% for the Year to Date and that is an improvement on the situation last time I checked a few weeks ago, when it was down about 10%. This Portfolio has partly suffered from Dividend Cuts but also because of Stocks like Shell RDSB and HSBA dropping, and also because I have not done the re-investment of Dividends that I should do because I have been tight on Cash resources and when you are running large Spreadbet Exposures it takes plenty of Cash to stay on top of things and provide sufficient buffer. Anyway, despite there being a lot of Bearish noises around, I am pretty much on the Bullish side of things and I am happy being 100% Long now with no Short Positions, and if I see the opportunity, particularly around mid December, then I will be looking to go a little bit more Long with a Long Index Spreadbet if I see the right signals. A Breakout above 6512 on the FTSE100 would be a Buy Signal and might tempt me into a small Long FTSE100 Spreadbet. Other than that my Strategy of not doing a lot will remain. Most Recent Podcast TPI 35 On Friday 6th November we released the latest Twin Petes Podcast and you can find it here on Soundcloud. If you use Apple, Spotify, Overcast, Audioboom etc., then go to the ‘Conkers Corner’ Channel and you want Podcast number TPI 35: https://soundcloud.com/user-479955511/conkers3-wheeliedealer-35-takeovers-500-lockdown-winner-lid-ao-hzd-dddd-crst-lid-fan You can also play the Podcasts directly from my website WD2 if you go to the ‘Twin Petes Investing Podcast’ page, where you will find the full archive of all episodes. A Previous Blog Injection I have been talking about ‘Bull Flags’ on Twitter and I will also probably mention the concept when I get on to the Charts bit in a tad. This Blog explains what I mean, and it is a major element of why I am feeling predisposed to be Bullish: https://wheeliedealer.weebly.com/educational-blogs/waving-the-bull-flag-with-special-guests-dtg-and-emr The full list of all the Blogs I have written over something like 7 years can be found on the ‘Blog Index List’ page on WD2 – most have a link to them and are easy to find and the Search Engine seems to work when I use it on my PC although not so good via my Fone. From that List I also bring you this one which is worth a revisit; it might prove very apt if we see the Rally continuing: https://wheeliedealer.weebly.com/educational-blogs/i-cant-buy-that-ive-missed-the-boat Blog Slate I have been working on a Blog which tries to define what a ‘Quality Stock’ is and I made good progress with that on Friday Night and hopefully in coming days I should get a chance to top and tail it and get it published. I am also aware that the one that is due to appear in a Magazine soon must be coming out in due course – I will stay alert for it and shout once it is published. I am not sure what I will start on next, but I have several in draft form that need sorting out and finishing – so if nothing new grabs my attention then I will go back to one of these and sort it out. Some time this week I will also be recording a new Podcast, TPI 36, and that should come out next weekend – I have loads of ideas for it so hopefully it will be to a decent standard. Let’s see why I am so Bullish then…….. Brent Oil Composite As always, the Charts I show are screengrabs from the quality SharePad Software that I use, and if you click on the images then they should get larger so you can see the details. If you fancy using SharePad or ShareScope yourself, then there are Advert things all over my Websites and if you click through then you can sign up and get 1 months’ worth of data for free. I also get a beer or two out of it so thanks immensely. I am starting off with Oil because it impacts the FTSE100 a lot due to the weightings of the big Oil Companies like RDSB and BP., but also indirectly because the cyclical forces that are likely to increase demand for Oil, will also drive up Cyclicals in the Index like the Banks and Miners. My Chart below has a fair bit going on – first off look at the Black Arrow which is marking a ‘Bull Cross’ between the Black 13 Day EMA Line (Exponential Moving Average – more recent days get a heavier weighting in the moving average calculation) and the Red 21 Day EMA Line. This is most definitely one of my fave Signals and pretty reliable although not so great when a Market is going sideways – it is possible that Brent Oil Comp is in such a sideways phase now, between the Horizontal Red Line at the bottom around $35.8 and the Horizontal Black Line at the top around $46.6. My Blue Ellipse is highlighting a Bearish Shooting Star Candle from Wednesday 11th November and that peaked out intraday at $45.3 which is now Resistance. In the 2 days since the Brent Oil Price has dropped back but not dramatically. For meaningful upside, we need to see that Resistance where my Black Horizontal Line at $46.6 is, broken through. 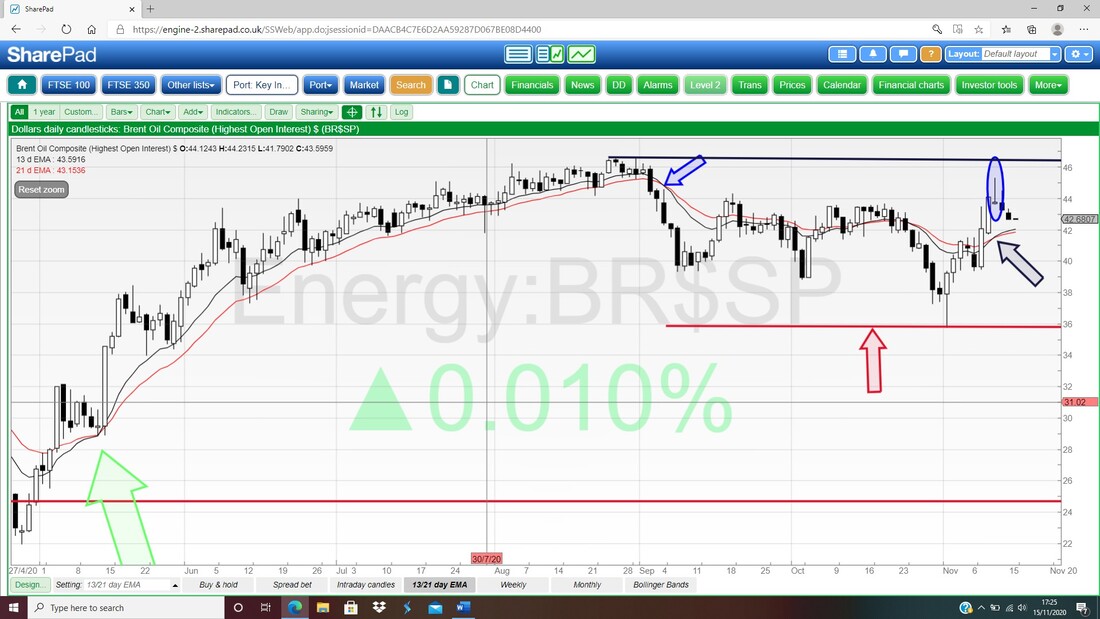
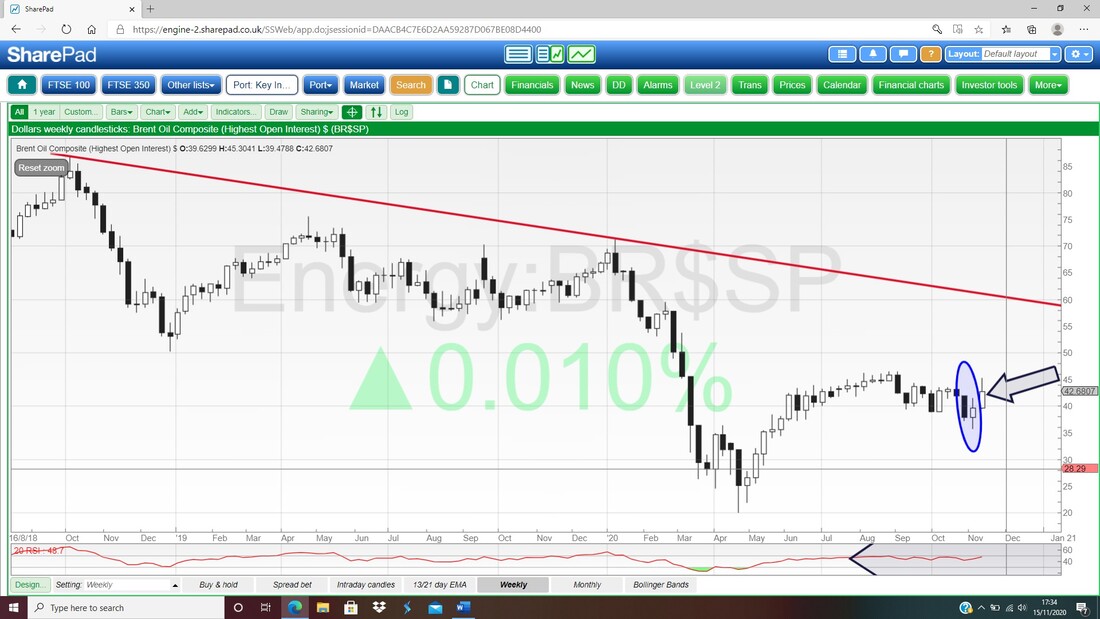
Next up the Weekly Candlesticks for Brent Oil Comp and my Black Arrow is pointing to an Up Candle from last week although it did not manage to hold the High. My Blue Ellipse is trying to show a 2 Candle Bullish Harami type pattern and this turned out to be predictive in that we rose last week – but to be fair this was not a great context for a Bullish Harami, so it is not as powerful. To be clear, this is a more positive Chart than it was, but we need to see the upwards momentum continued.
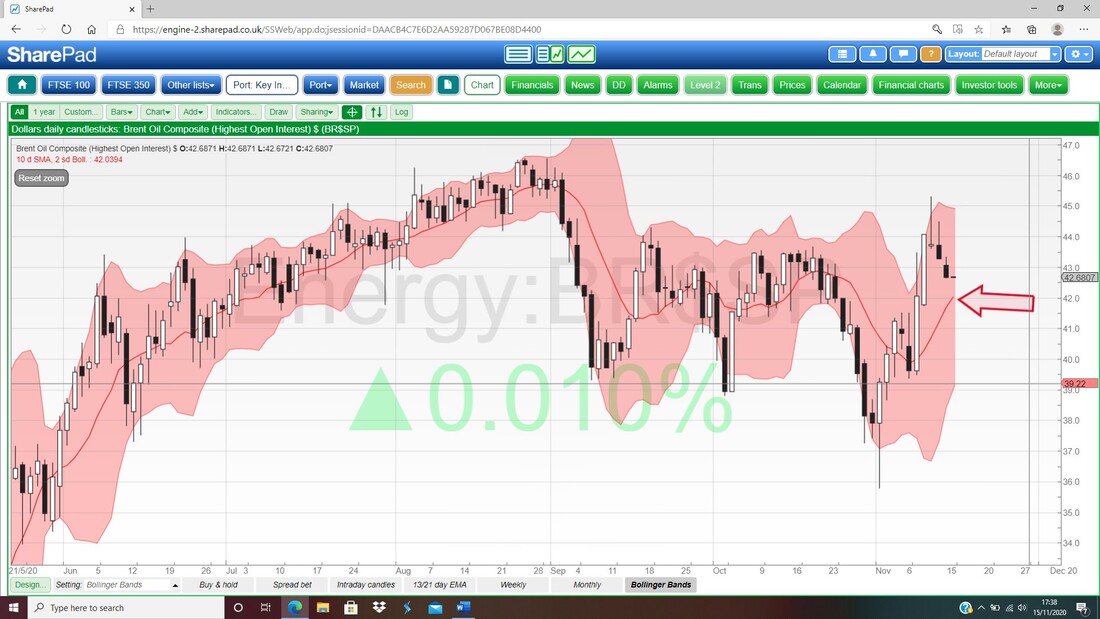
Finally for Brent Oil Comp, here are the Daily Candles with the Pink Zone marking the Upper and Lower Bollinger Bands. Note how on that Wednesday Spike Up and the Bullish Shooting Star, the Price was outside the Upper Band and then dropped back. Since that the Price has fallen and now the Midpoint Line (marked by my Red Arrow) at about $42 comes into play and may act as Support. The Bottom Band is down at about $39.2.
FTSE100
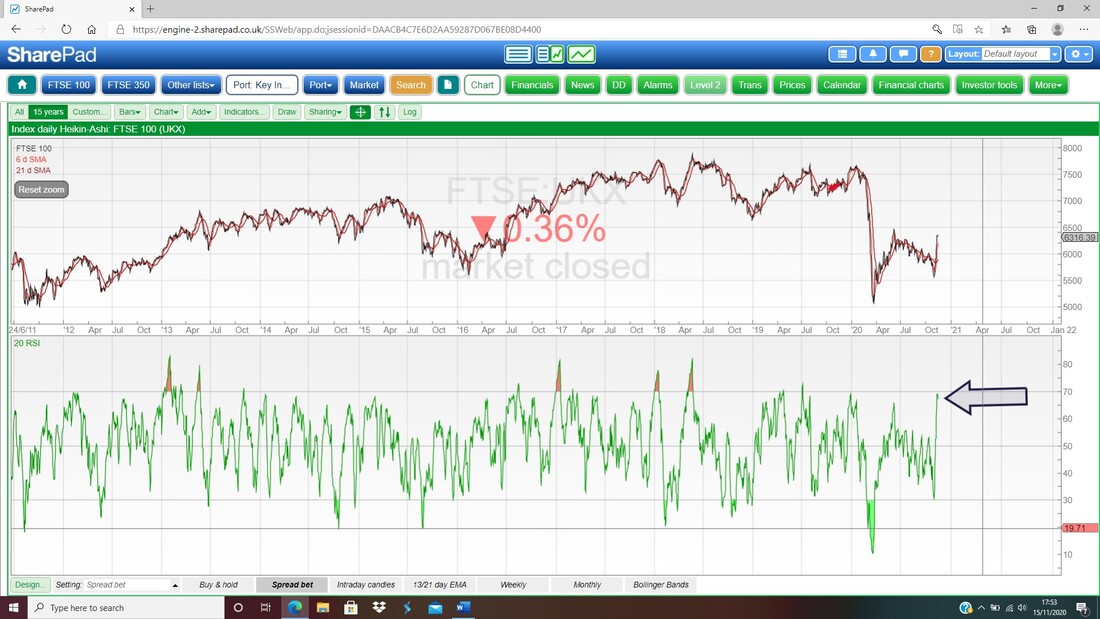
This should be interesting because a lot happened last week. First up here are the Daily Candles but my focus is firstly on the Bull Cross between the Black 13 Day EMA Line and the Red 21 Day EMA Line, which is where my Black Arrow is. This suggests more upside for weeks to come. If you count back through the Candles, you should be able to work out that where the Big Jump of the huge White Candle is, was from Monday and that move triggered both the 13/21 Day EMA Bull Cross and the Breakout form the Downtrend Channel marked by my parallel Green Lines which I have been talking about for weeks on my blogs. This Breakout is extremely significant and the mood here has changed considerably. My Red Arrow is pointing to a Peak from Wednesday at just under 6400 and since that we have dropped back a little but note the Candle from Friday Closed off the Low of the Day at 6280 and my hunch is that we are building a ‘Bull Flag’ pattern here (see my section on previous Blogs where I have included a Link to a Blog all about Bull Flags and why they are such great news). So what I think we have here is a jump up on Monday to Wednesday which represents the ‘Flag Pole’ and now I think we are going into a Sideways wobble that will form up the Flag part – if I am right, then it will be a precursor to another big jump up. No one is expecting this which to my mind makes it even more likely !!! Other to the left, my Blue Ellipse is trying to mark a Long Tails Doji from back in early June and that has a High at 6512 and a Breakout above this would be extremely bullish and it is possible we will see this in coming weeks. 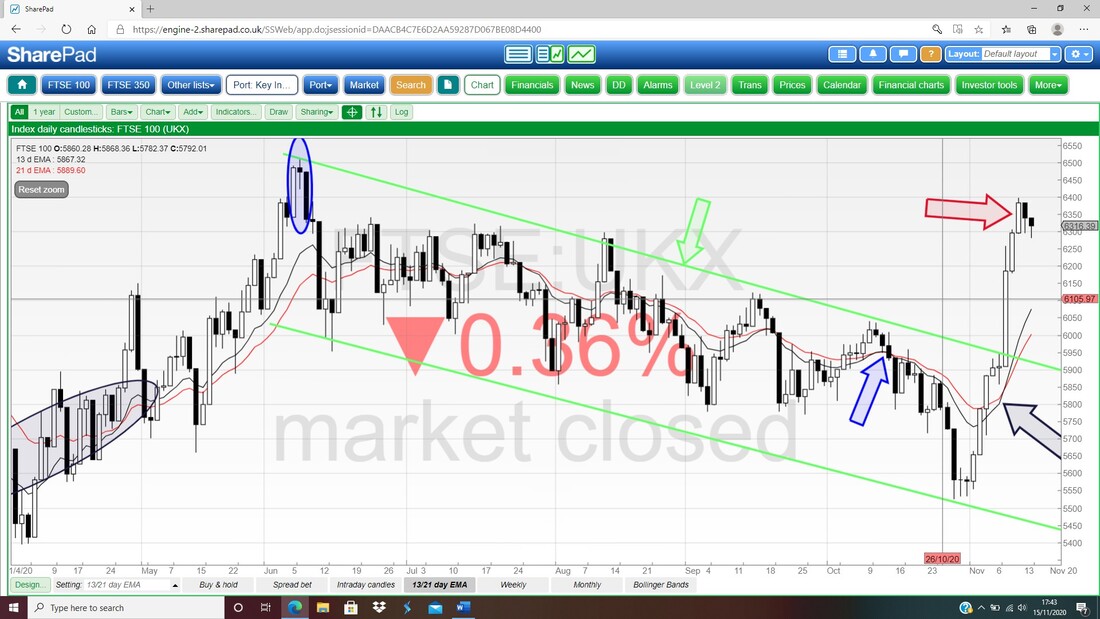
In the bottom window on my Screen below we have the RSI (Relative Strength Index) for the FTSE100 Daily and my Black Arrow is pointing to a Reading of RSI 67 which is a very high level. It is for this reason that I expect the FTSE100 will now grind sideways for a bit which will unwind this overbought RSI Reading – perhaps down to around 55 or something.
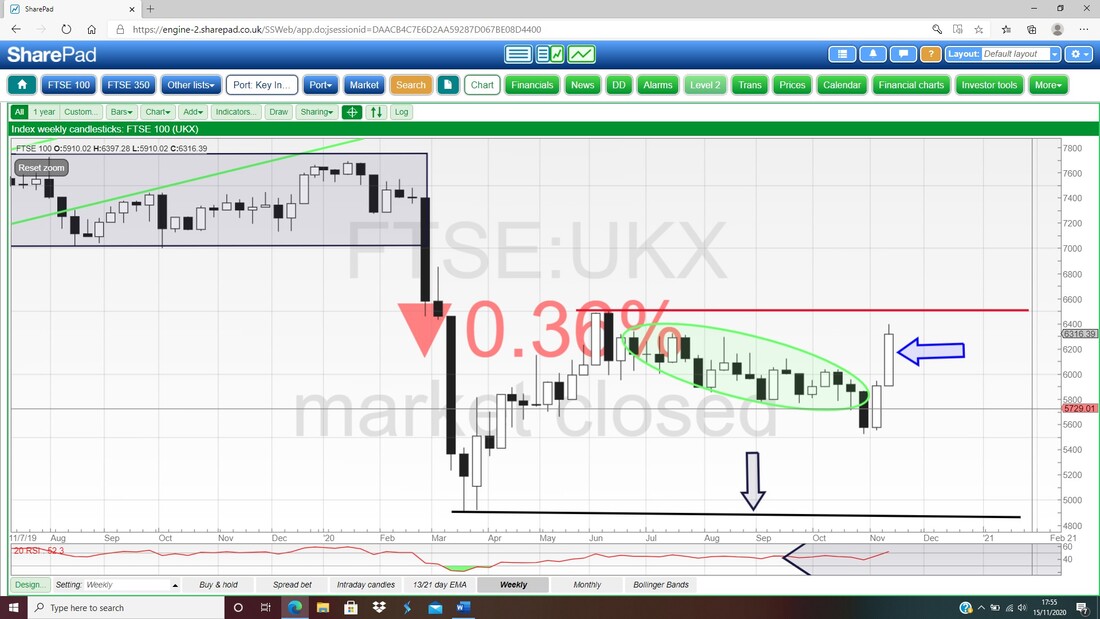
Next up the Weekly Candles for the FTSE100 and my Blue Arrow is pointing to a big Bullish Up Candle for last week and note how that built on a Bullish Up Candle from the week before. Clearly now it is all about the Red Line at 6512 and the FTSE100 must crack through that. If it does cleanly break 6512, then that is a huge Buy Signal.
What I am showing next is a bit naughty because it is not really valid yet. Anyway, this Chart has the Monthly Candles for the FTSE100 and my Red Arrow is pointing to a Black Down Candle from October and this built on a series of weak looking Candles.
However, if the Candle from October is going to be accurate in its predictive power, then the Candle for November should have Opened lower and we can see that even though the November Candle is nowhere near valid yet, we can see that is has Opened where October left off and since that it has jumped up. We would need 2 bad weeks now to make this November Candle look ugly. 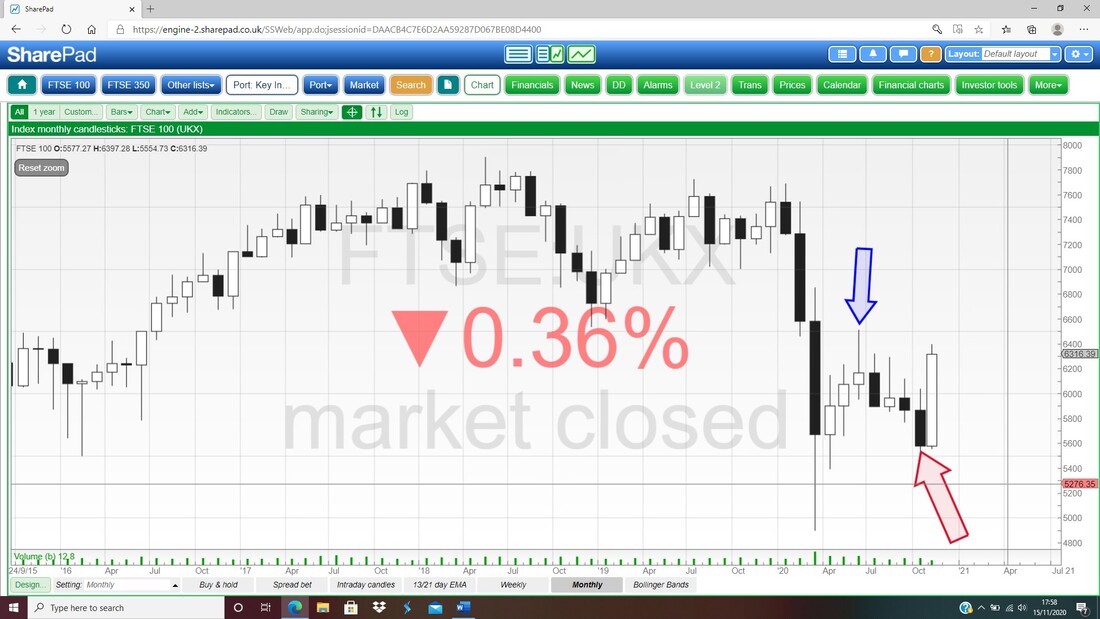
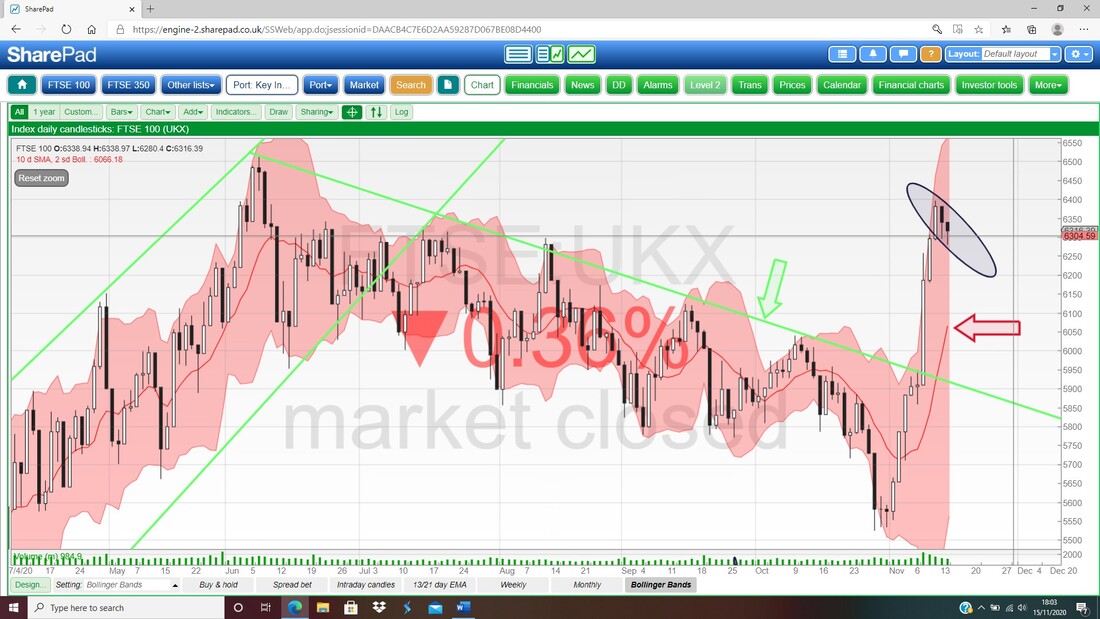
Last for the FTSE100 the Daily Candle and the Bollie Bands. My Black Ellipse is capturing how the Price has moved away from the Top Bollinger Band and note my Red Arrow is pointing to the Red Midpoint Line at about 6065 which could be Support. Note, if the Price wiggles sideways as a I suspect it will, then we will see the Midpoint slowly rise.
S&P500
Below we have the Daily Candles for the S&P500 and my Green Arrow is pointing to a Bull Cross between the Black 13 Day EMA Line and the Red 21 Day EMA Line. Note, this Signal is not so great in a Sideways Market so we need to be aware of that, but if we see a Breakout higher above the Blue Line at about 3588 and then above the fresh New All Time High (ATH) at 3646 from Monday (in my Blue Ellipse), then that would suggest the predictive power of the Bull Cross is working its magic and we will see weeks of gains ahead. I suspect we might get a sideways wobble for a bit, and there is good Support just above 3500 from last week and that could limit downside. My Red Arrow is pointing to a big White Up Candle from Friday and that looks pretty bullish……. 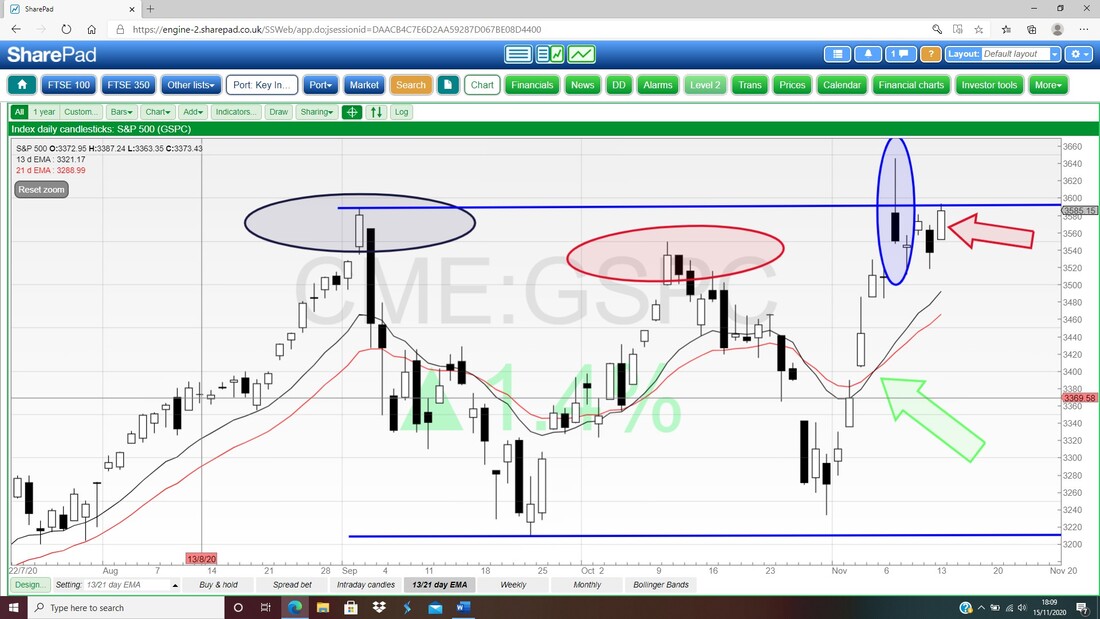
Next the Weekly Candles for the S&P500 and my Blue Arrow is pointing to a Long Tails Doji from last week which suggests indecision. Down below, my Black Arrow is pointing to Support around 3200 and below that my Red Line is marking Support at 2965.
A Long Tails Doji can mark a Turning Point which could mean we will get some sideways now. Watch that ATH at 3646 because that is the key. 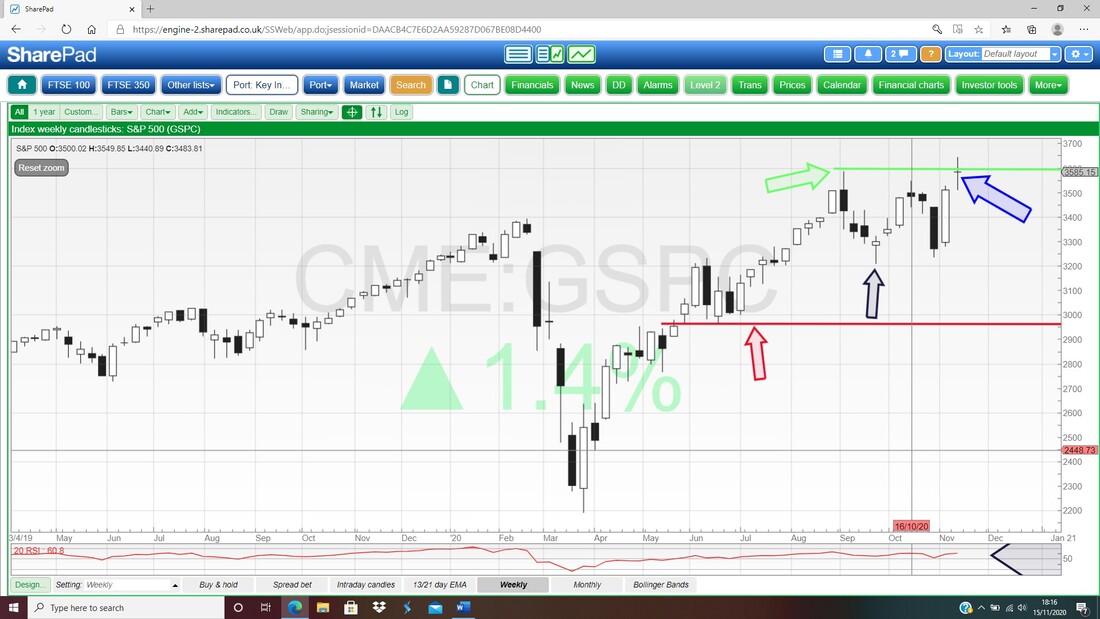
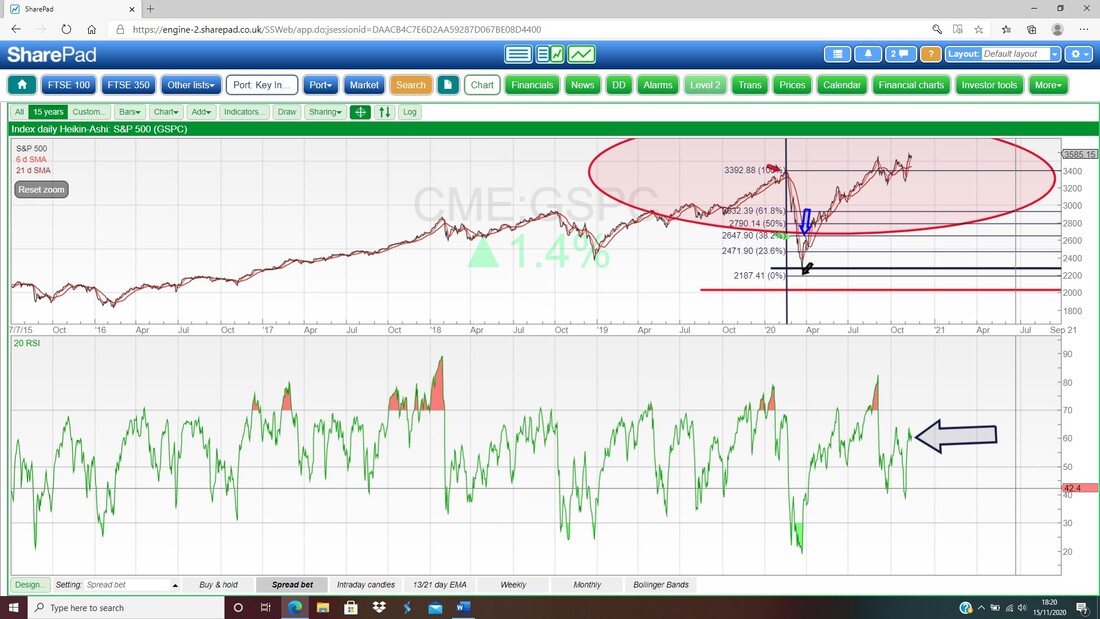
The bottom window on the screen below has the RSI for the Daily on the S&P500. A Reading of RSI 61 where my Black Arrow is suggests room for more gains in the short term. In other words, this is not Overbought.
I won’t show the Monthly Candles for the S&P500 but it is a similar situation to what I mentioned regarding the FTSE100 – but remember this is not a valid set of Candles yet.
Next we have the Daily Candles and the Bollingers. Note how the Price has drifted sideways away from the Upper Band and my Red Arrow is pointing to the Midpoint at about 3495 which could be Support. 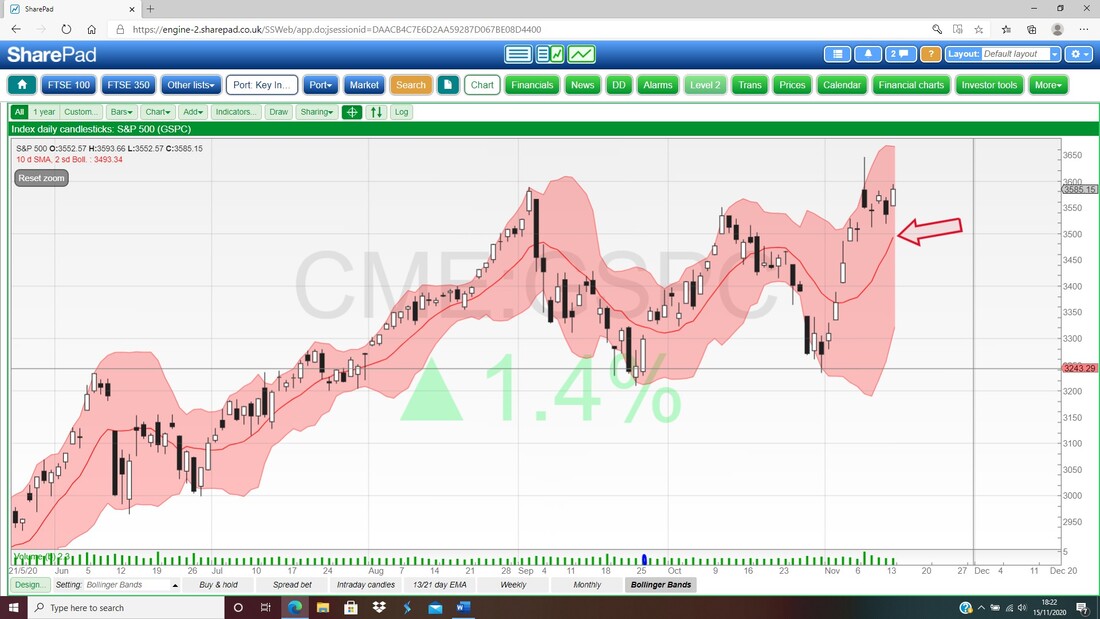
Vodafone VOD
This has been intriguing me for a while so I wanted to lob it in my Blog. VOD has Results on Monday (tomorrow) and that might give some more clues. As it stands the Dividend Yield is expected to be 6.8% which is very juicy and it has been cut recently as well. We also have the Towers business being spun-out which could add some excitement. My Chart below has a Long-Term Downtrend Channel, as marked by my Parallel Blue Lines, and at the moment VOD is trading very much within the confines of this Downtrend. What Bulls need now is a Breakout to the upside (I’m a Bull because I hold VOD !!) and firstly that means breaking through the Blue Top Line at about 130p and to be sure we need to crack about 143p, which is where my Red Arrow is. Such a Breakout would suggest the Downtrend is ending. 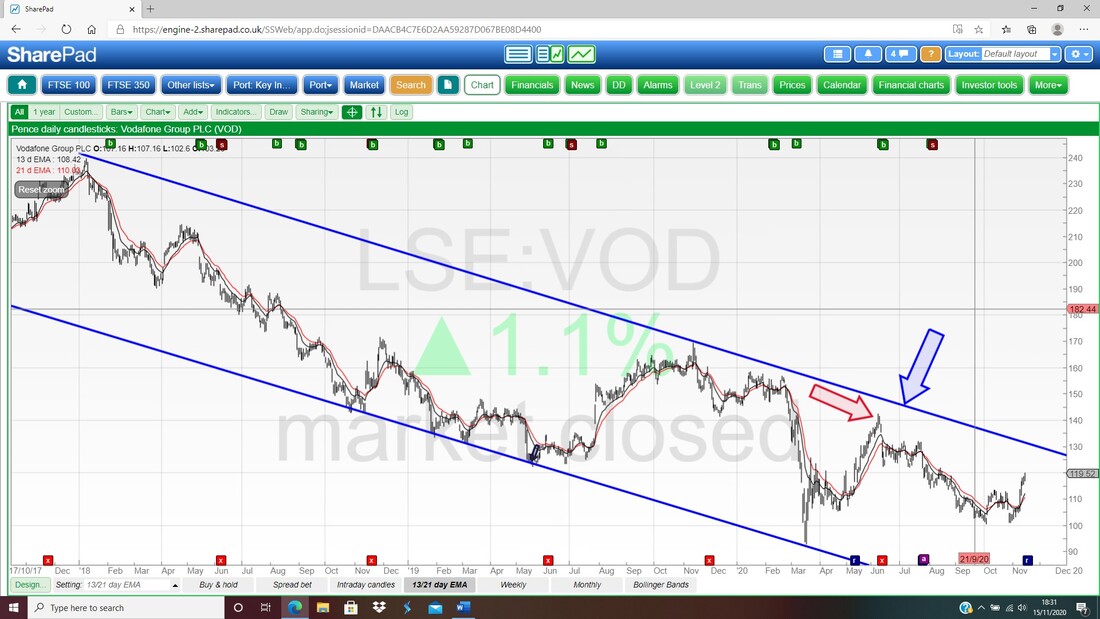
On the next Chart of VOD I have zoomed in on the Daily Candles and first up my Green Arrow is pointing to a Bull Cross between the Black 13 Day EMA Line and the Red 21 Day EMA Line. This suggests more upside.
My Black Arrow is pointing to a big White Up Candle from Friday and this looks bullish. I won’t show it, but the Daily RSI is reading 65 which is high but leaves a little room for upside if the Results are ok tomorrow. OK, that’s it for this weekend, good luck in the coming battles !!! Cheers, WD. 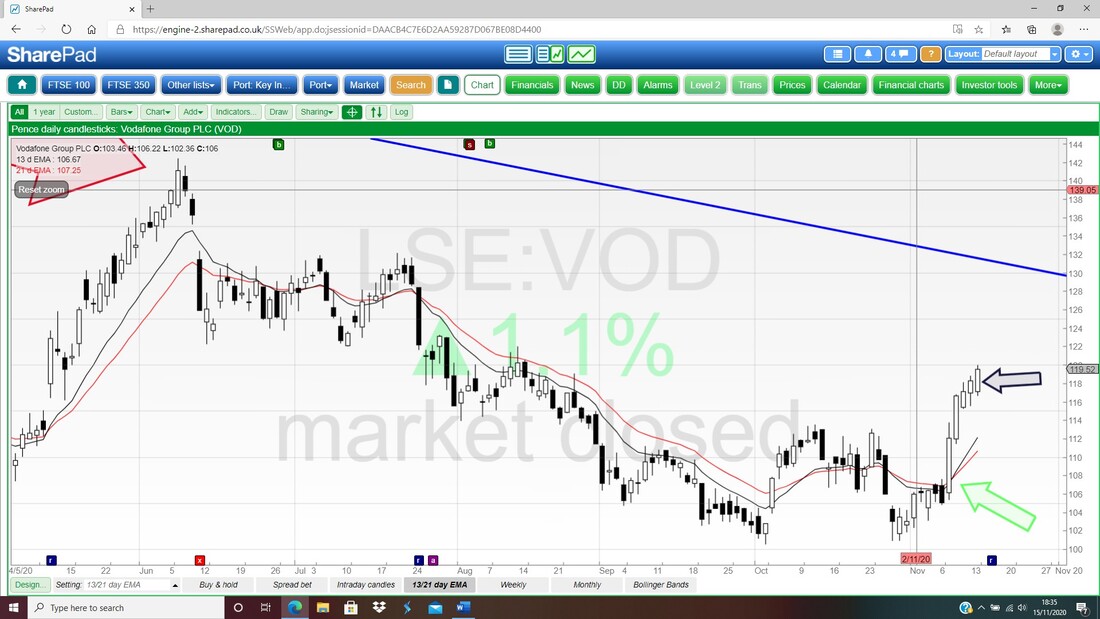
0 Comments
Leave a Reply. |

Stocks & Markets WheelieBlogsThese tend to be more Markets and Stocks related and timely - the Blog Page on the Main WheelieDealer Website has the 'Educational' stuff (well that's the theory anyway !!). Archives
October 2021
Categories
All
|
