

|
stocks & Markets blog |
|
I spent Friday in the best possible way with the utter pretence that I was ‘working’ by meeting up with about 6/7 very good Investing Mates at the White Hart, Winkfield (the WheelieBash Pub) and it turned out a hugely enjoyable day and what was supposed to be Lunch and a few hours after, ended up going on til near 8pm or something. Most amazingly, we had our lunch in reasonable sunshine/cloud but then it started raining and it didn’t stop at all – but none of us really minded or noticed that much, and we were able to hide under the Canvas bits and carry on making out that we were working hard on our Investments !!
It was a hugely enjoyable and useful day and Thank You to the chaps that came along to while away the afternoon with me. This week I should be meeting up with another Mate at the White Hart so I have definitely got my priorates nicely sorted.
Last Week
Despite May not being the ideal month, at least the final week for me put in a gain of 1% and strangely that was exactly the same as the week before, and those 2 weeks combined offset the big loss of the week before. Weird. We are into the low-volume and often very dull Summer Months now (and at long last the Sun has decided to join the party !!), and I have no intention to do much at all. My focus has to be on getting myself better and parking my butt in the Garden of the White Hart as much as possible (in no particular order of priority !!) and I cannot see myself doing much in terms of Investing etc. I will be on my guard for any signs of concern in case I need to Hedge, but in truth I cannot see anything in particular that alarms me at the moment. June itself is often a down month but we tend not to get heavy falls in this month but I cannot say the same about the Autumn and once we get into late August, September (historically the worst month) and October, we will need to be well alert to any signs of a proper drop coming along. If I have time, I will be doing some admin stuff around getting a Spreadbet Account ready so I can test my fabled New Index Trading System. As always, we talk a lot about these sorts of things at the start of our Podcasts. This coming week we have the US Non-Farm Payroll numbers on Friday (this is usually 1.30pm UK time) and that will be fun for the Day Traders if not much other use. The last numbers were pretty low so there is likely to be a much higher figure this time. Blog Slate Sadly I am still by no means ‘right’ and this is limiting me with time at my Desk hitting the keyboard. Anyway, my plan is as I mentioned last week that I want to write first about the New Index Trading System that I have dreamed up, and I need to do it to help me structure my thoughts and make sure I have ironed out the creases in the theoretical logic, before I start testing the system in anger (well, hopefully not too angry because it is important that I keep my emotions on an even keel at all times !!). After that I will move to the LOK one and in addition, I need to update the ‘Monthly Performance’ page with details for May. Sadly I have to report that I think my Portfolio is down a tiny bit for that month. I hadn’t realised that I had not updated the ‘Little Black Book’ page for so long and as a result there are stacks of Stock Ideas on there that may inspire you to do further in-depth research on. This coming week we plan to record TPI 50 Podcast which is a bit of a milestone, putting it mildly. We intend to do something a bit special on it and hopefully all our ideas will fall nicely into place. That one should be out next weekend and, in the meantime, you can find the latest Podcast (TPI 49 obviously !!) by going to the ‘Twin Petes Investing Podcast’ page on WD2 or you can click on these Links for Soundcloud and YouTube: Soundcloud here: https://soundcloud.com/user-479955511/conkers3-wheeliedealer-49-futr-tsla-vod-bt-dgi9-air-pcf-ftse-btc-doge-insg-dia-ai And you can hear it on YouTube here: https://www.youtube.com/watch?v=QDMZU9MmIIo Picking Nuggets out of the Wheelie Washplant In a typically surreal manner, I found out that 2 young lads who live a few doors away, have an interest in Trading/Investing. I have talked to them quite a bit in recent days and pointed them in the right direction on a few things, hopefully. One of them washes my Cars and slashes the Strimmer etc. around the Jardin de Wheelie (bring your Motors round and he will do them for you – a Tenner a pop !!) and I mentioned a few Blogs from the past for him, and I thought I would just sling them in here and then all Readers can benefit if you fancy. As always, these Blogs can be found on the ‘Blog Index List’ page on WD2 and they have links and stuff so you can get to them. First up, an extremely important Blog about Compounding Returns over time: https://wheeliedealer.weebly.com/educational-blogs/why-bother-investing-the-power-of-compounding This one is about System, Process, Optimise: https://wheeliedealer.weebly.com/educational-blogs/optimising-the-wheelie-wash-plant This next one is about a superb ‘System’ Jason @stealthsurf on Twitter uses (Link to Part 1 at the top of this one): https://wheeliedealer.weebly.com/educational-blogs/a-truly-genius-system-for-making-money-part-2-of-2 S&P500 All the Charts I show are taken from the excellent SharePad software I use and if you click on the images then they should get a bit bigger on your screen (I recommend you read these Blogs on a big screen rather than just a Fone – there is a lot of detail to be seen). I know some Readers actually look at their Charts on SharePad or whatever method they use as they read through my blogs. If you fancy using SharePad or ShareScope yourself, then you can get 1 month’s Free Data if you go to the ‘Subscribe’ page on their website and then select the Product you want, and then you should see a ‘Promo Code’ box and if you type ‘twinpetes’ into that box, then the discount will apply. You can also get this by clicking on the Adverts that are all over my websites. I get a small payment for introducing you, so thank you very much !! (it’s just a shame I can’t spend it on beer at the moment…..) https://www.sharescope.co.uk/ I noticed also that SharePad/ShareScope have updated the landing page on their website and there is much better detail regarding the capabilities and features of their software now. I am starting with the S&P500 because I don’t want to spend hours on this and I will just look at this one and the FTSE100. If you follow me on Twitter, you may have noticed that every Night about 10.15pm or so, I Tweet out what I am seeing on the Indexes and cover all the Major ones and several for the UK. I do this because it is extremely useful for my Investing and I might as well let Readers know what I am seeing at the same time. Because all the Markets are Closed on Monday, I will show the Monthly Candles because they are now valid. This should be interesting and I am eager to see how they turned out !! First up we have the Monthly Candlesticks for the S&P500 and my Blue Arrow is pointing to the Candle for May and arguably this could be seen as a ‘Bearish Hanging Man’. However, I think we need to be careful as always and not just assume this means Markets will drop back. The easiest measure of potential outcomes for June is to see how the new Month Opens and if it Opens down below the Candle for May (so that the ‘Hanging Man’ acts as a Turning Point), then that would be an early suggestion that June could be troublesome. June is historically a dodgy Month but not necessarily an awful one. Most likely it will be a typical Summer Month with low volumes and plenty of choppiness and silly little wiggles in our Stocks. If the new Candle for June Opens higher, then that is a very promising sign that June will be a good Month. 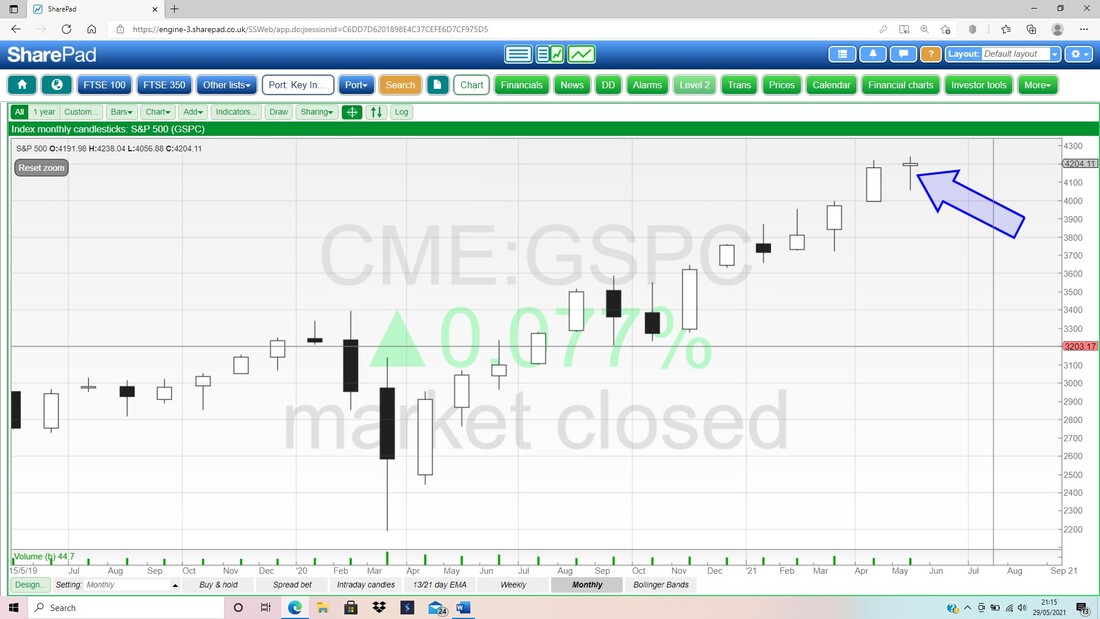
Next up the Weekly Candles for the S&P500. If you read my ‘Stocks & Markets’ Blog from last week, then you might have seen the bit where I drew the Uptrend Channel marked by my Parallel Black Lines on the Chart below, and I was unsure how to exactly place the Bottom Support Line, marked by my Black Arrow.
Anyway, things have moved on and I have now moved the Black Line a shade and this looks a reasonable fit. My Blue Arrow is pointing at a small Up Candle from last week (really a Doji) and note this was a gain off of a Hammer Candle from the week before and a similar sort of Hammer from the previous Week to that. This is a good indication that my Black Bottom Support Line (Black Arrow) is acting as Support and the S&P500 Price is wiggling inside this fairly narrow Uptrend Channel. 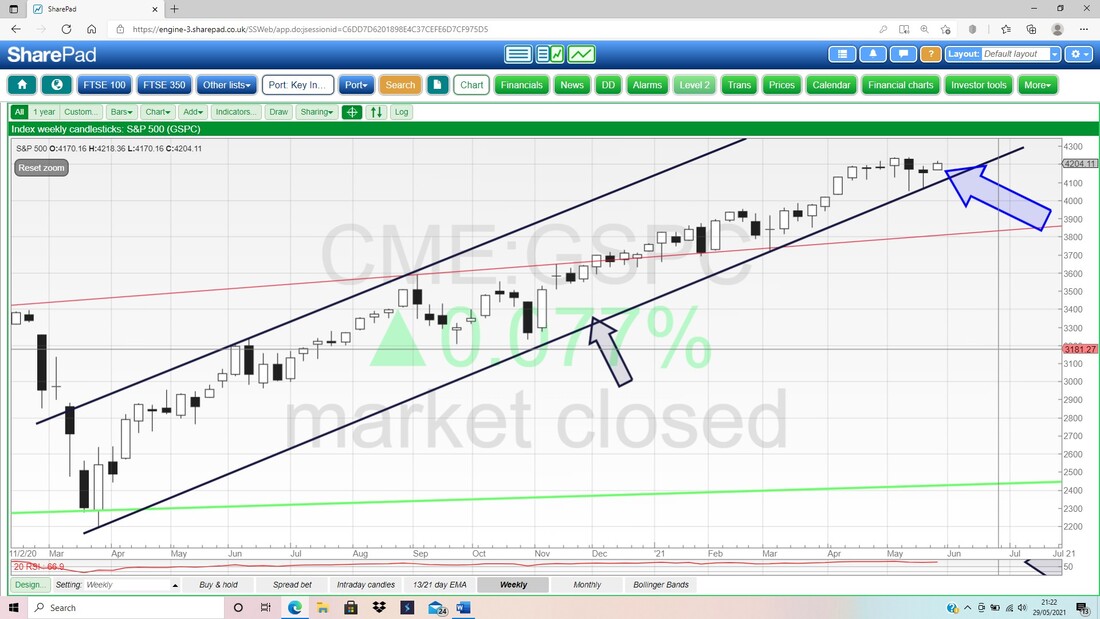
I actually find the next Screen a bit concerning. In the bottom window below we have the RSI (Relative Strength Index) for the S&P500 Weekly and on a Reading of RSI 67 where my Blue Arrow is, this is pretty high and it could mean any further gains are limited without some sort of Consolidation.
A Price Consolidates by either Price or Time. By Price it means a fall and this unwinds the high RSI Reading, and by Time it means the Price just sort off wiggles sideways and gradually the high RSI drops back. The first of these is a bit painful but it gets the process over with quite quickly and is in many ways more pleasant. I utterly hate long slow grinding sideways Markets and I recall one year that this sort of behaviour occurred for about 6 months. I was utter hell !! 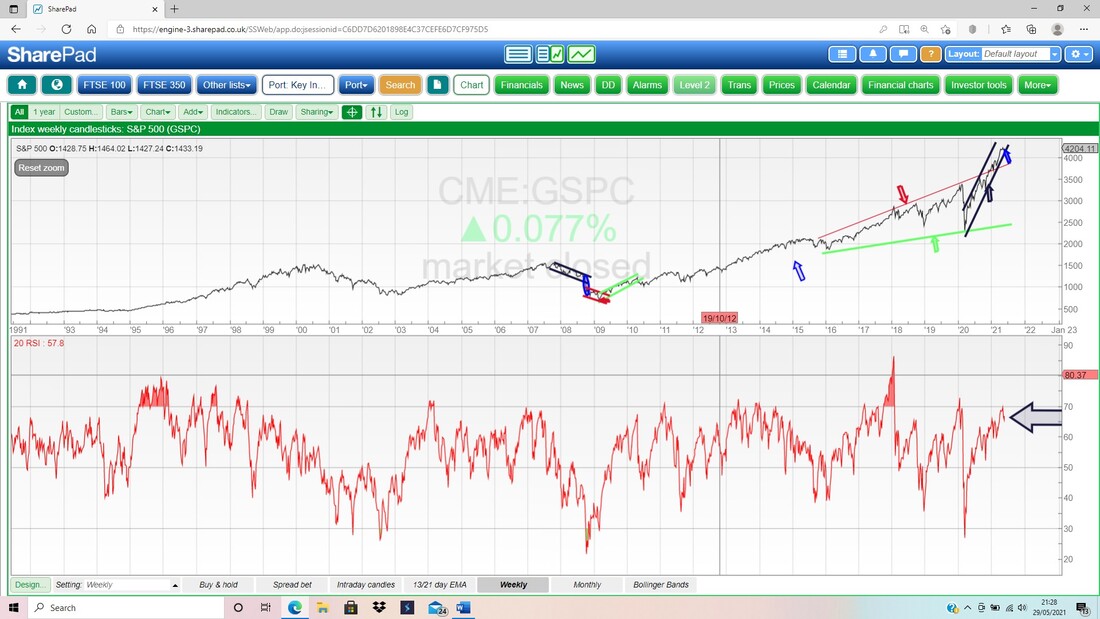
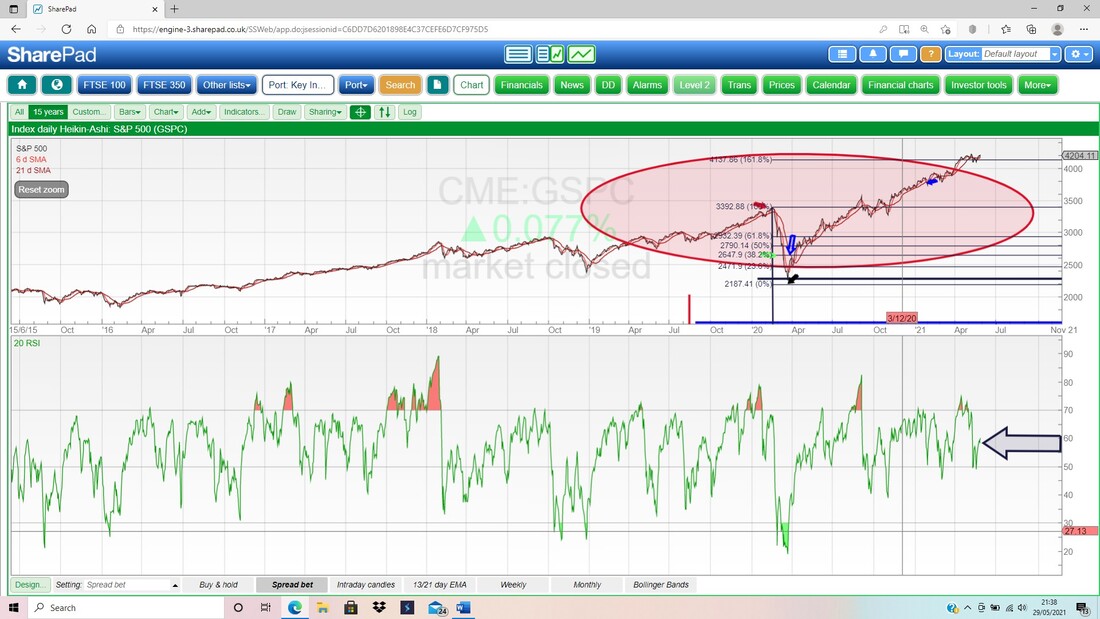
While on the subject of RSIs, here in the bottom window is the RSI for the Daily S&P500. On a Reading or RSI 57 where my Black Arrow is, this is not high at all and implies that in the short term, the S&P500 could rise quite a bit but the Weekly suggests the Upside might have limits.
Next up I am purely interested in the 2 wiggly Lines – the Black 13 Day EMA (Exponential Moving Average) and the Red 21 Day EMA. My Green Arrow points to a ‘Bull Cross’ where the ‘Faster’ 13 Day EMA crossed the ‘Slower’ 21 Day EMA Line and this has been in force since then. If you look at the Blue Arrow – we nearly got a ‘Bear Cross’ (the opposite crossover) but it narrowly avoided it.
The current situation on this excellent Indicator is that it looks good for the Bulls. 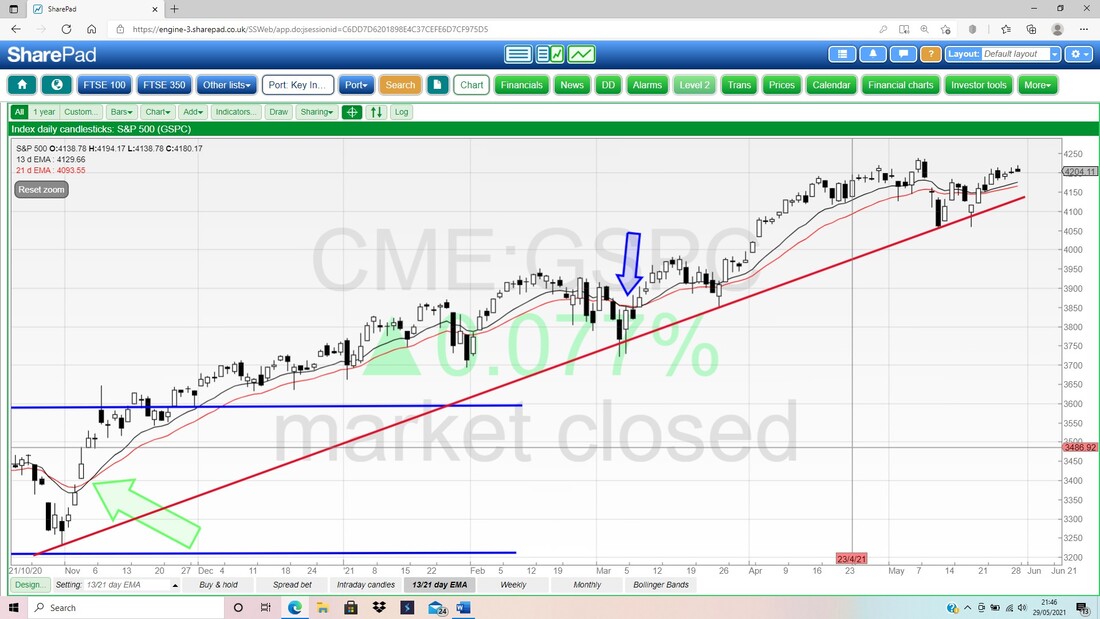
Finally for the S&P500, we have the Daily Candles with the Pink Zone marking the Upper and Lower Bollinger Bands. My Blue Arrow is pointing to a small Doji Candle and it has a slightly Bearish tinge to it but in the context of a quiet Friday just before a Bank Holiday Weekend, I am not sure we can read much into this. I just think it is part of a Sideways Consolidation move if anything.
The Top Bollinger Band is at 4232 and the All Time High was about 2 weeks ago at 4238. Obviously, a Breakout over the ATH is Bullish. To the downside, there should be Support around the Midpoint Line (the Red Line marked by my Red Arrow) and this is at 4170. The Bottom Band is at 4110 and there is Support down at 4056. Note the lovely example of a Hammer Reversal Candle inside my Green Ellipse. 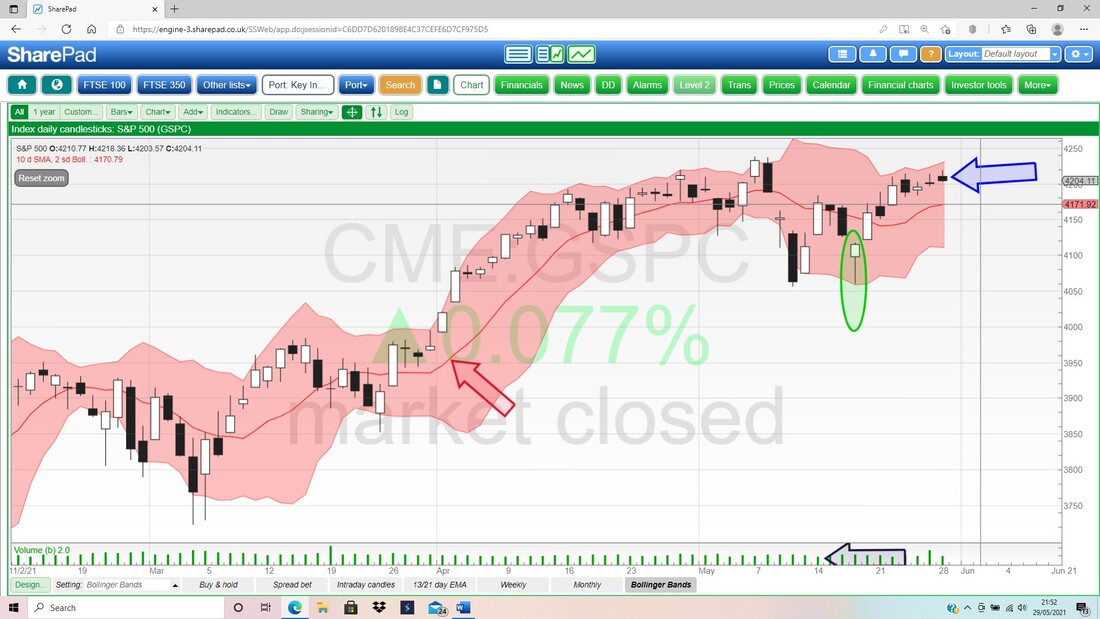
Brent Oil Composite
Below we have the Daily Candles for Brent Oil Comp, but first I want you to just look at the Black 13 Day EMA Line and the Red 21 Day EMA Line. There was a ‘Bull Cross’ where my Black Arrow is and this is still very much in force. My Black Arrow is pointing to a Small Down Candle from Friday but I don’t think we should read too much into this with the Bank Holiday Weekend. To the upside, the Brent Oil Comp Price needs to crack $70 and then $70.3 and then $71.4 which is where my Black Ellipse is. If this is achieved, then the focus moves to $75. To the downside, there is Support at $64.5 and then down where my Green Ellipse is there is a Zone of Support which takes us down to near $60. 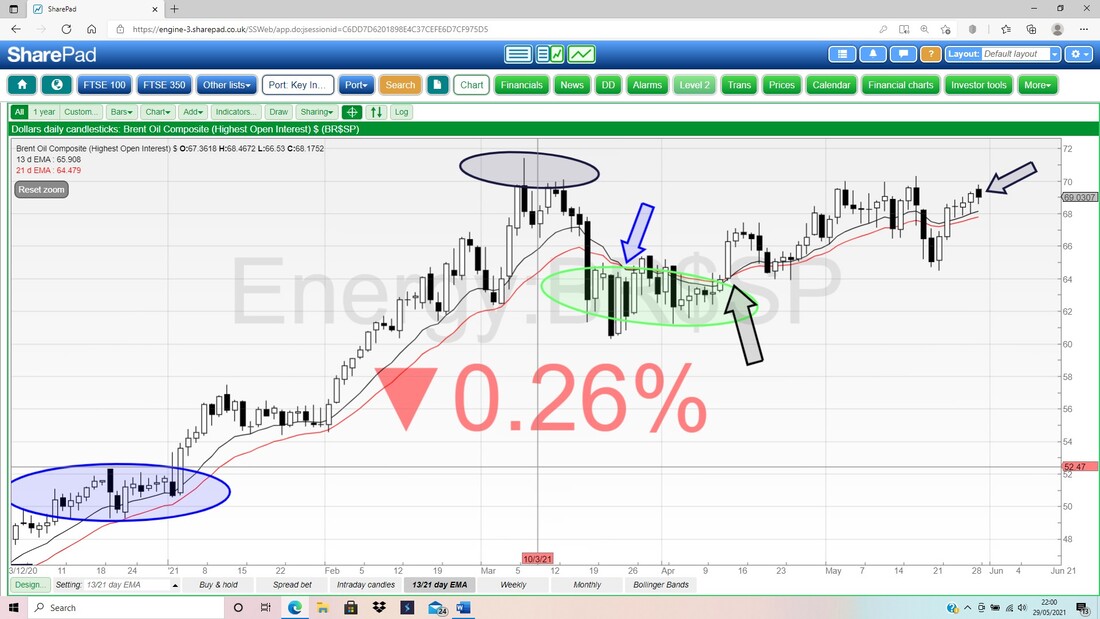
The Monthly Candles don’t look too bad. My Red Arrow is pointing to a Small Up Candle for May and I think it is positive. OK, you could argue this is a Doji from which the Brent Oil Comp Price could turn down, but I don’t think that interpretation is right. The test is that $71.4 Level – if that is taken out then things are good.
My Blue Arrow is marking Resistance up around $75 and my Green Arrow is showing Resistance at $86.7. 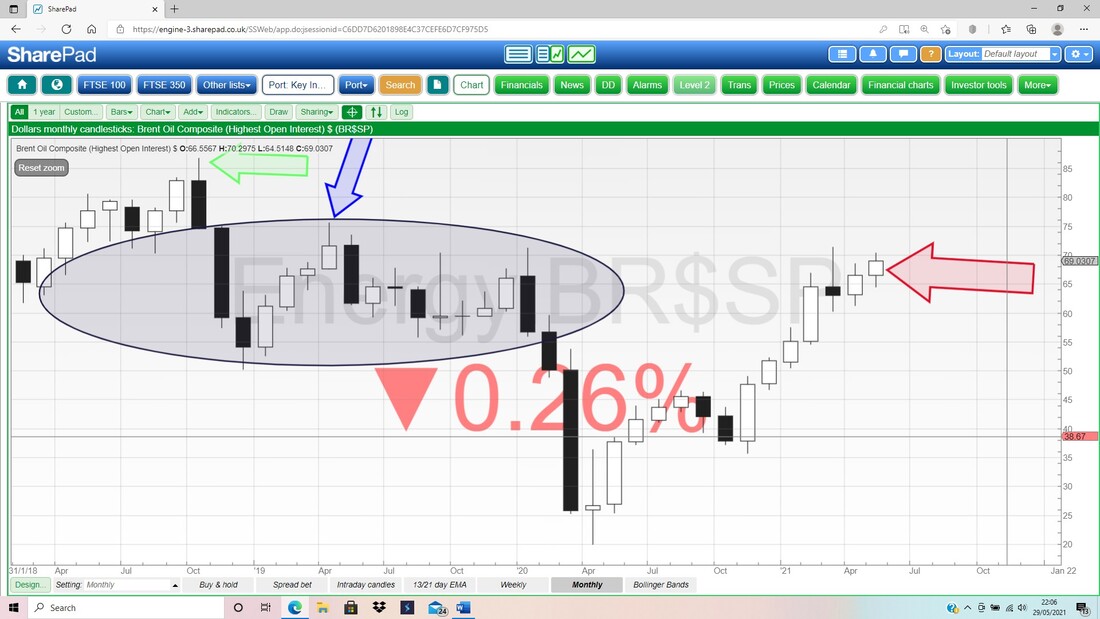
FTSE100
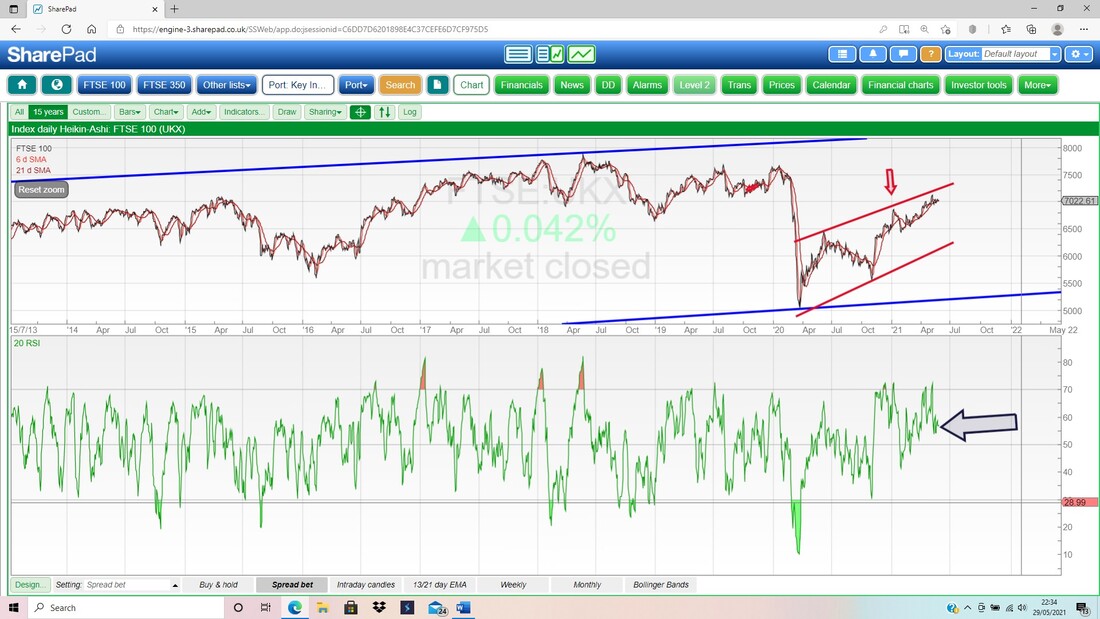
First up we have the Monthly Candles. My Blue Arrow is pointing to a ‘Long Tails Doji’ for May and this could be a Turning Point Down – however, it is not a hugely reliable Signal and we can test this by seeing how the first few days of June play out. If they are good, then it is probably going to be ok and the ultimate test is whether or not the High of May at 7164 is taken out. 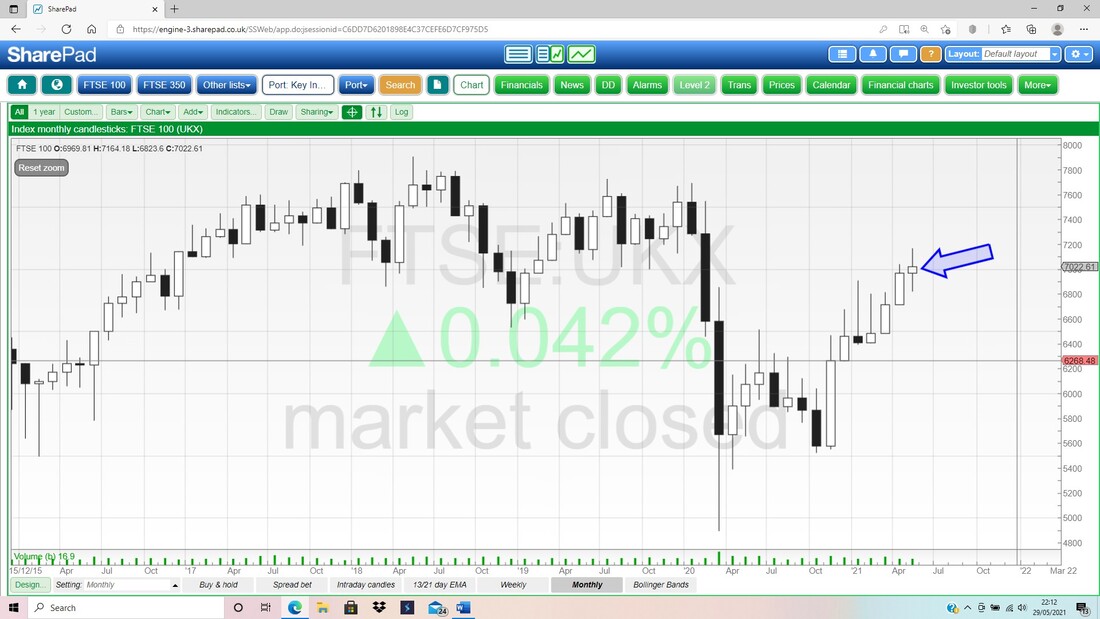
In my next Chart we have the Weekly Candles for the FTSE100 and my Blue Arrow is pointing to a Small Doji Candle for Last Week. It has a Bearish tinge to it with the Small ‘Wick’ going up above the ‘Body’ but I am not sure we should read too much into this.
Note my Uptrend Channel marked by the Parallel sort of Pink/Purple Lines is still looking like constraining the Price. To the upside, there is Resistance at 7164 and then where my Black Box is in the Top Left-Hand Corner, there is Resistance from about 7200 to 7600. To the downside, there is Support at 6823 and then 6618 and down to 6400. 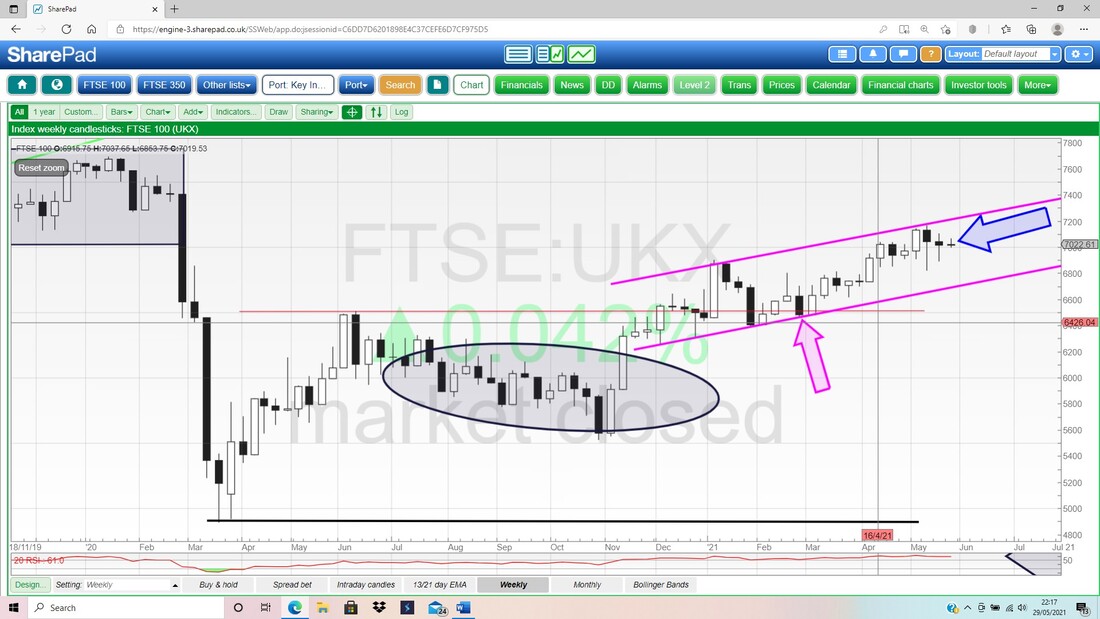
Next we have the Daily Candles for the FTSE100 but my focus really is on where my Blue Arrow is and then the Green Arrow, which shows that the 13 and 21 Day EMA Lines are very much in Bull Mode.
My Blue Ellipse is marking a Candle with a High at 7000 which is now Resistance and my Green Arrow is marking that High at 7164 which is Key Resistance to breakout of. 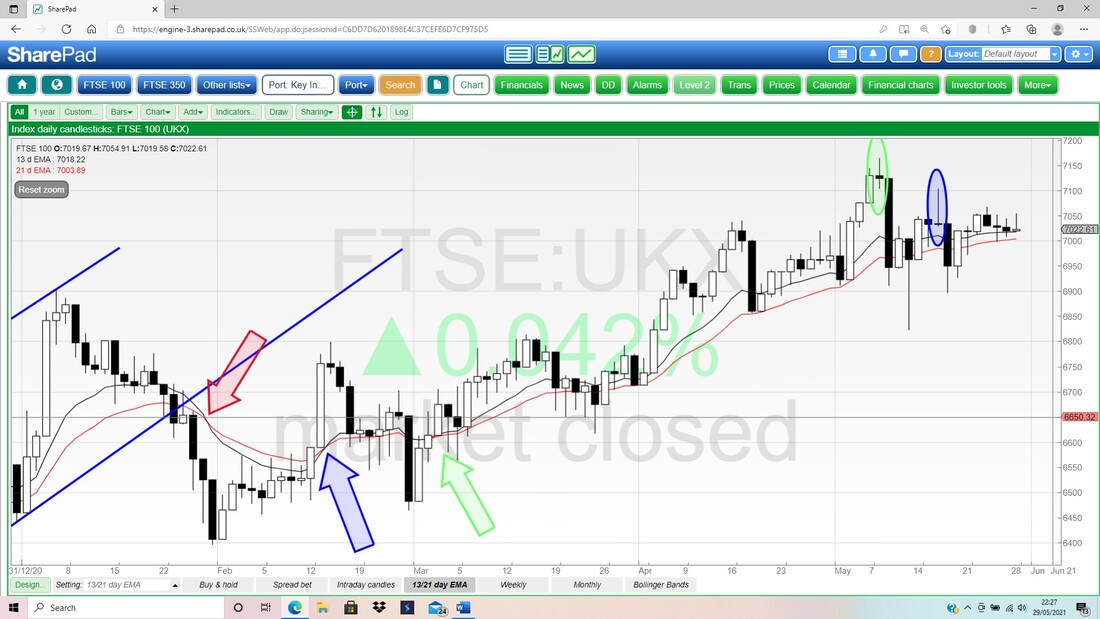
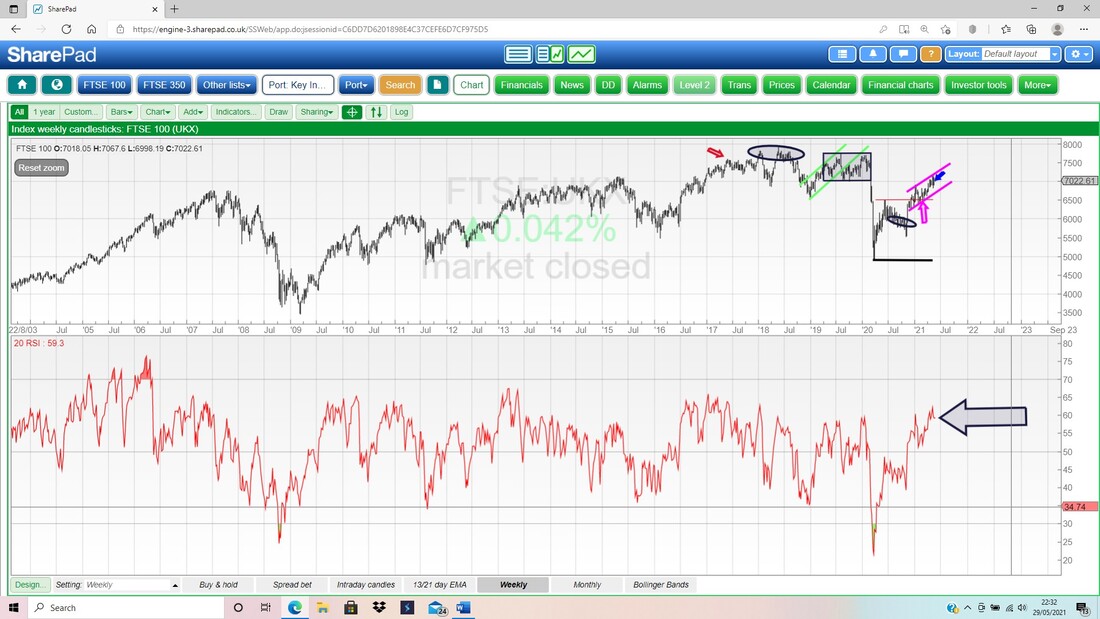
In the bottom window on my next Screen we have the RSI for the Weekly FTSE100. Where my Black Arrow is we have a Reading of RSI 59 and in the context of previous Peaks, this doesn’t seem all that high although there are many instances where the FTSE100 has dropped from here, or at lease Consolidated sideways.
In the bottom window on this next Screen, we have the RSI for the Daily FTSE100. On a Reading of RSI 57 where my Black Arrow is, this is by no means high and suggests the FTSE100 can rise quite a bit into June if it does get in the mood.
My final Chart tonight has the Daily Candles for the FTSE100 and the Pink Zone marks the Bollinger Bands. My Black Arrow is pointing to the Candle from Friday and this has a ‘Bearish Inverted Hammer’ sort of shape, but it is a weak context for this Candle to be a problem and really it is now about Support and Resistance. Remember Friday was very low volumes and just before the Bank Holiday Weekend so not all that representative.
To the Upside we are looking at the Upper Bollinger Band at 7072 and the Bottom Band is at 6970. Note the Red Midpoint Line (Red Arrow) is at 7022 and that the Candle from Friday Closed around this Line. OK, that’s it for this Week. Have a great Week ahead and I hope the Market Gods are very generous to us all !! Cheers, WD. 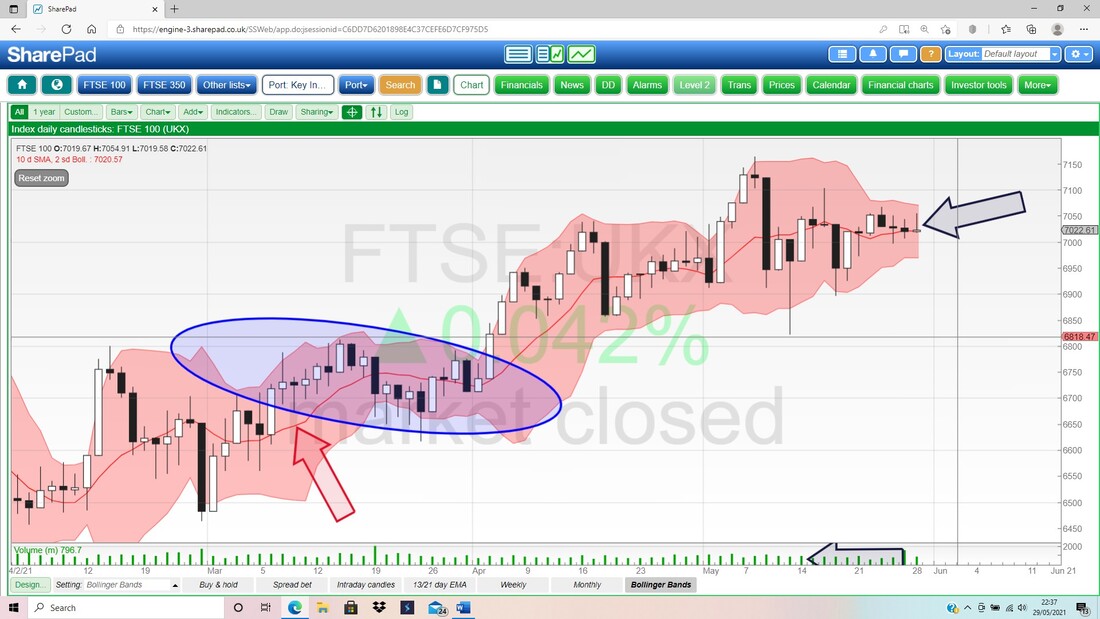
0 Comments
Leave a Reply. |

Stocks & Markets WheelieBlogsThese tend to be more Markets and Stocks related and timely - the Blog Page on the Main WheelieDealer Website has the 'Educational' stuff (well that's the theory anyway !!). Archives
October 2021
Categories
All
|
