

|
stocks & Markets blog |
|
I’m starting really late tonight because the MotoGP from Texas had to take precedence over all else and of course they have a time difference which isn’t ideal for me getting a Blog scribbled. So it might not be all that long but the main thing is to look at those Charts and see how the Markets are shaping up and I have also managed to bung in some interesting Stock Charts.
With Easter coming up we have two short weeks ahead with Good Friday then Easter Monday being Bank Holidays so the Markets are likely to have low volumes and could do some ‘weird’ stuff - from memory when we get such conditions we often get a ‘melt-up’ where the Markets steadily climb and this would chime with the usual April behaviour where the Month tends to be strong all the way through. Sadly May gets a lot tougher with it on average being the second worst Month so we might be in for something less pleasant in a few Weeks time.
The Brexit silliness has sort of been kicked into touch with an Extension to Halloween and this obviously removes for a while any risk of ‘No Deal’ although that is not entirely impossible and we could also be treated to things like a General Election which might not help the mood. Theresa May wants to avoid doing the EU Parliament Elections and has said as much with another attempt to get her Deal through again seeming quite likely - although it probably will still struggle to get through. This is highly dangerous for the Conservative Party though because if the EU Elections happen then this could give a big springboard to Nigel Farage’s new ‘Brexit Party’ and that would probably erode the Conservative Vote in future.
The next 2 Weeks might not be too noisy on the political side because of the Easter Break and Parliament not being in session but after that it will no doubt be more ‘Pistols at dawn’……. It might be because Brexit Risk has lowered but it struck me that last Week the smaller Stocks did better (from that I mean FTSE250 and below really) and this could just be more of a ‘Risk on’ mood. That would suit me really as my Portfolio is mainly the smaller stuff and I have Shorts on the FTSE100 so maybe my Portfolio can outperform the drag from the Shorts better. In time I hope to get plenty of opportunities to unwind the Shorts and with Summer often being weak and with Autumn having a very bad reputation, I am likely to get such chances to escape the Hedges. On the Economy, it is clear that the UK is struggling and so is Europe but I have seen a few comments that there are some better signs around. It is not anything really solid yet but I will be tracking what is going on. Last Week A strong Week for my Portfolio even with a strange ‘swap’ by Canada Pensions selling out of Pets at Home PETS which I hold and then buying into the Entertainment One ETO Placing (which I also hold) - both Stocks got hit a fair bit on Friday as a result but my Portfolio still managed 1.25% on the Week which I am really pleased about. This means that for the Year to Date I am down about 1.3% and this is after a big drag from my Hedges - if my hunch that the Smaller Stocks are perking up plays out then I might be able to get into Positive territory before long. By the way, I am still very happy to hold both PETS and ETO although I did chop a bit off my ETO position recently (see my ‘Trades’ page) because it had grown hugely and it was too big really. Videos I haven’t fully made a decision on this yet but sharp Readers might have seen that I have a page on WD2 which is called ‘Pod casts / Videos’ and I keep adding Podcast Links onto this page and I worry that the Videos are getting hidden away. I recommend you have a look at these if you have not seen them as they were recorded a few years ago now but had a tremendous response at the time. I am toying with the idea of pulling the Videos out from that page and giving them their own page or at least a higher profile - I will mull it over. On the subject of Podcasts, Peter @Conkers3 and myself are hugely pleased with the response we have had and note that well over 3000 listens have now been logged which is a great sign that people find them useful. If you like what you hear it might be worth ‘following’ us on SoundCloud and downloading the App and all that stuff. My expectation is that we should have another Podcast out in about a Week’s time. Blog Slate A few days ago I got round to sticking out the first of the Blog Series on my approach to working through Results Statements and Trading Updates etc. every morning and the next two bits should appear in the next couple of weeks. I thought they were pretty much complete but having thought about Part 2 again I actually need to add a fair bit to it but I think I can nail that this Week and get it out in a few Days. Part 3 is actually pretty much complete and is a practical exercise using MPAC to show the particular concept I am exploring in it. I’ve got a few other Blogs in draft and I hope to get time to start on another that needs my stunning MS paint ‘skills’ with loads of diagrams. I am also mulling the idea of a very basic one about Charting / Technical Analysis just to repeat the basics really because I still think it is very misunderstood. On Friday night I updated the ‘Little Black Book’ with some Stock Ideas and I particularly bring your attention to Elektron EKT which looks pretty undervalued to me. History Lessons This ‘old’ one is not from all that long ago, dating from March 2017, but I actually had forgotten all about it and from a quick whiz through it looks like there is some useful stuff in here - check it out !! http://wheeliedealer.weebly.com/educational-blogs/how-i-manage-so-many-stocks That’s the ‘admin’, let’s do the Charts……. S&P500 As always the Charts and stuff shown here are from the wicked SharePad Software stuff that I subscribe to and if you click on the pictures then they should get bigger so you can see the details better. My Chart below shows the Daily Candlesticks on the S&P500 and I just want to make the point that we are getting very near the All Time High at 2941 and this is caught within the Black Ellipse at the top sort of in the middle. Note also how the Price is hugging that steep Blue Line (marked by my Blue Arrow) and if the Price falls through this (or just moves sideways through it) then this might suggest the force of the move up is coming to an end. I suspect that ATH will be hard to get through but if it does that is Bullish; the biggest challenge to this happening might be the onset of Summer which tends to be the weak 6 months period of a typical year. 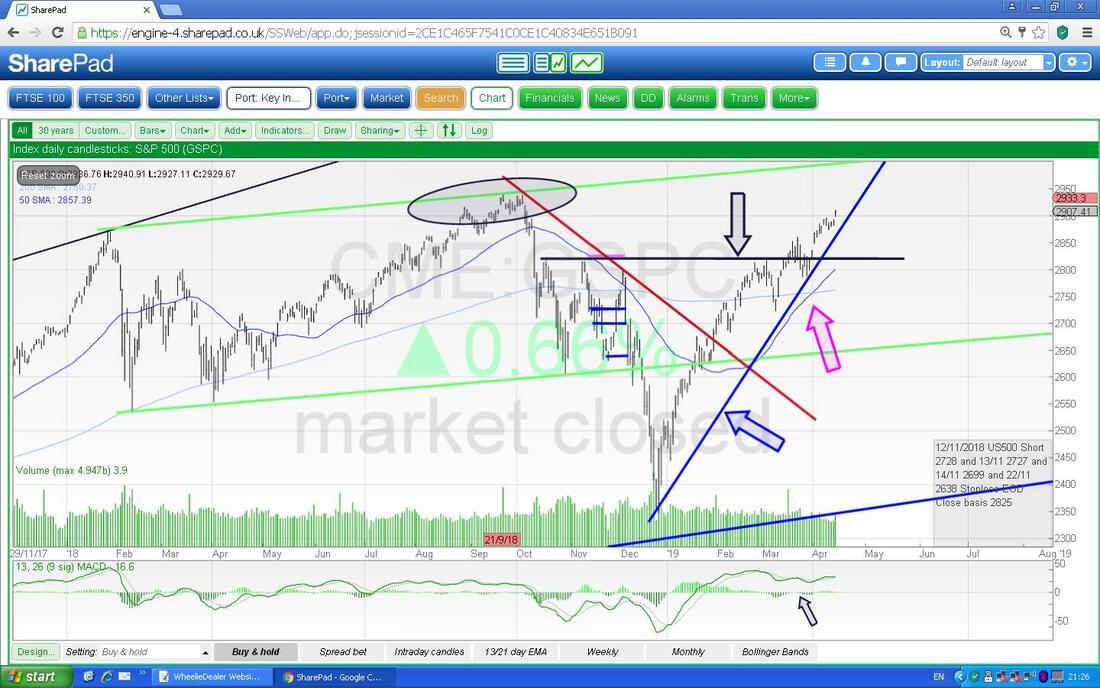
On the Chart below I have just zoomed in a bit and the Arrows and stuff are as on the previous Chart but I have added the Red Ellipse which captures loads of small ‘Doji’ Candles and these suggest to me a lack of oomph here and there is no real upwards force. Maybe the Market is tired or maybe I am just interpreting it wrongly !!!
It could be more of a ‘Consolidation’ sort of move before another strong move up but I would lean more to the weakness argument really. 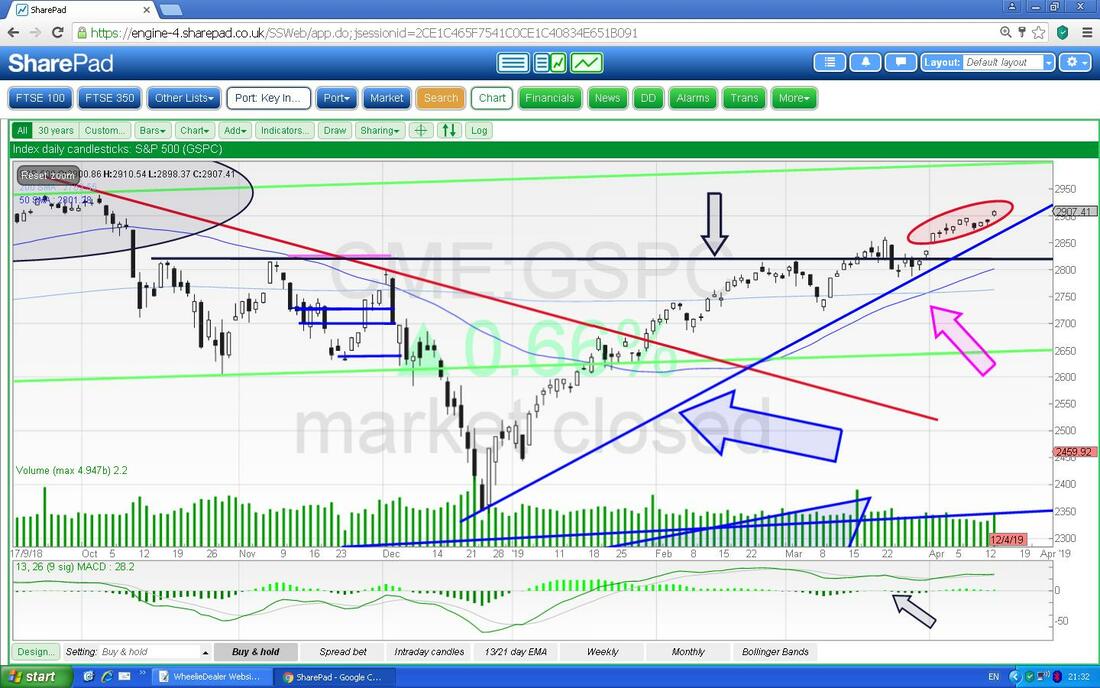
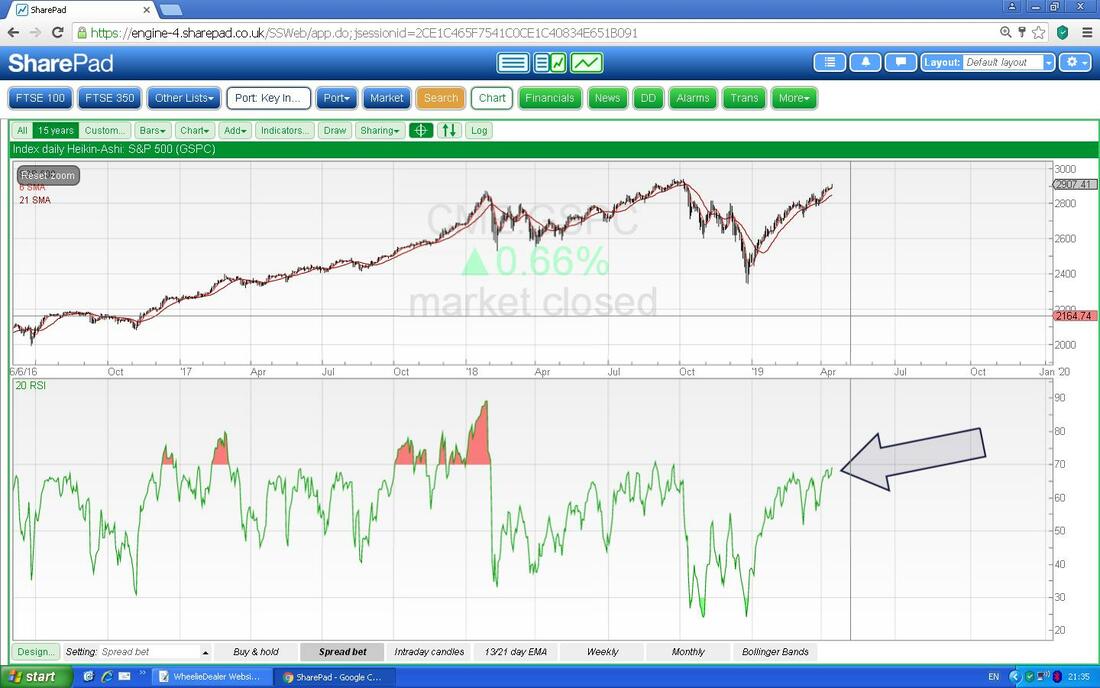
In the bottom window on the Screen below we have the RSI (Relative Strength Index) for the S&P500 Daily - on a Reading of RSI 69 this is very high and could turn down easily.
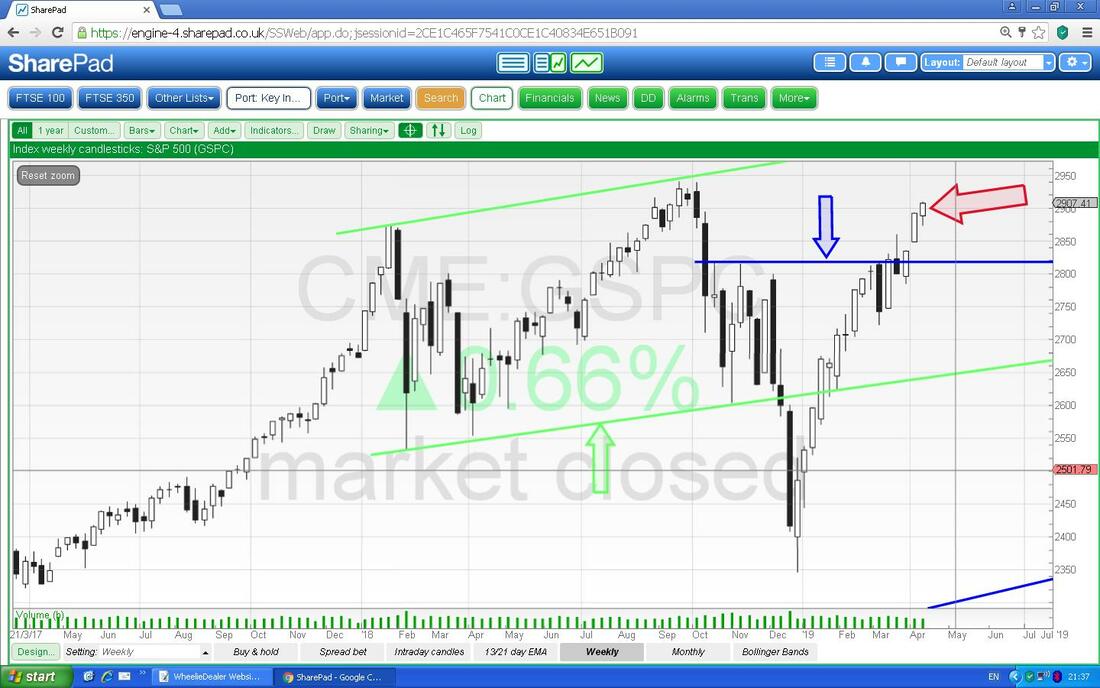
The Chart below has the Weekly Candles for the S&P500 - my Red Arrow is pointing to a White Up Candle from Last Week and this suggests more upside. On this Chart you can really see how close that All Time High is.
The Chart below has the Daily Candles and the Pink Zone marks the Upper and Lower Bollinger Bands. My Arrow is pointing out that the Candle from Friday is up at the Top Band - this could mean a drop back in the short term or maybe to go sideways.
I have a small Short on the S&P500 as part of my Hedging. 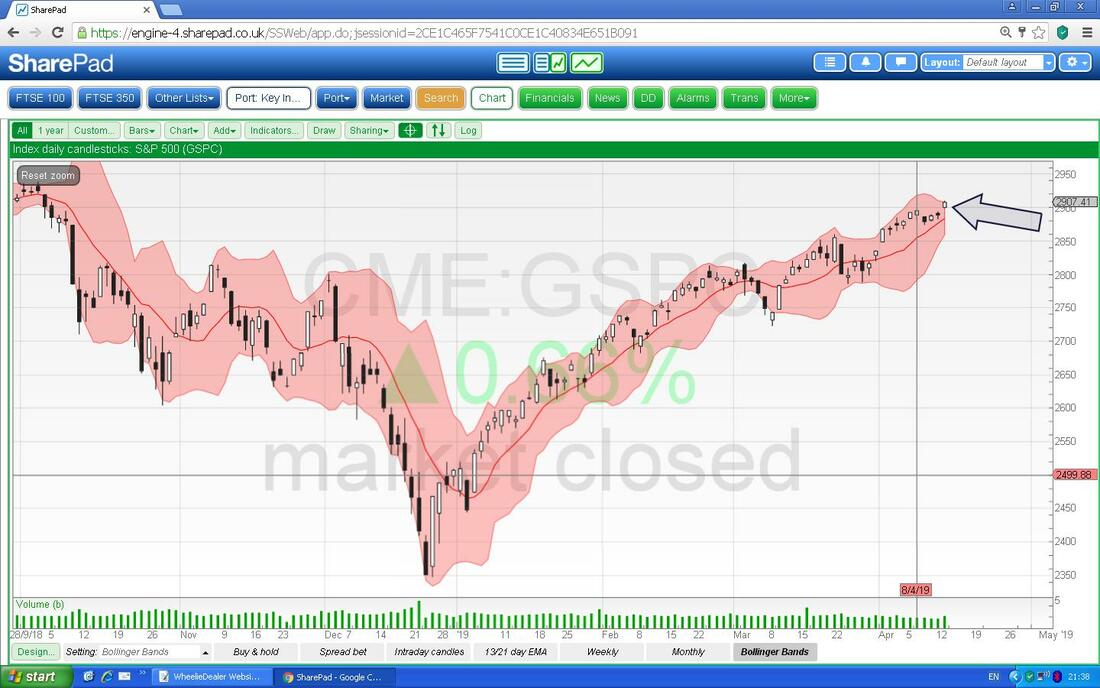
FTSE100
This is a big Short Position for me and it has not played out ideally !! Anyway, on the Chart below please ignore the ‘mess’ and just focus on the bits I point out. First off my Blue Arrow is showing how the Price has got up to the Black Resistance Line (marked by my Black Arrow) and just about limped over it and needs to stay above this. In the Left Hand Corner we have a Big Black Ellipse and this is a Zone of Resistance that takes us right up to the All Time High at about 7903 - I think this will be tough to wade through. 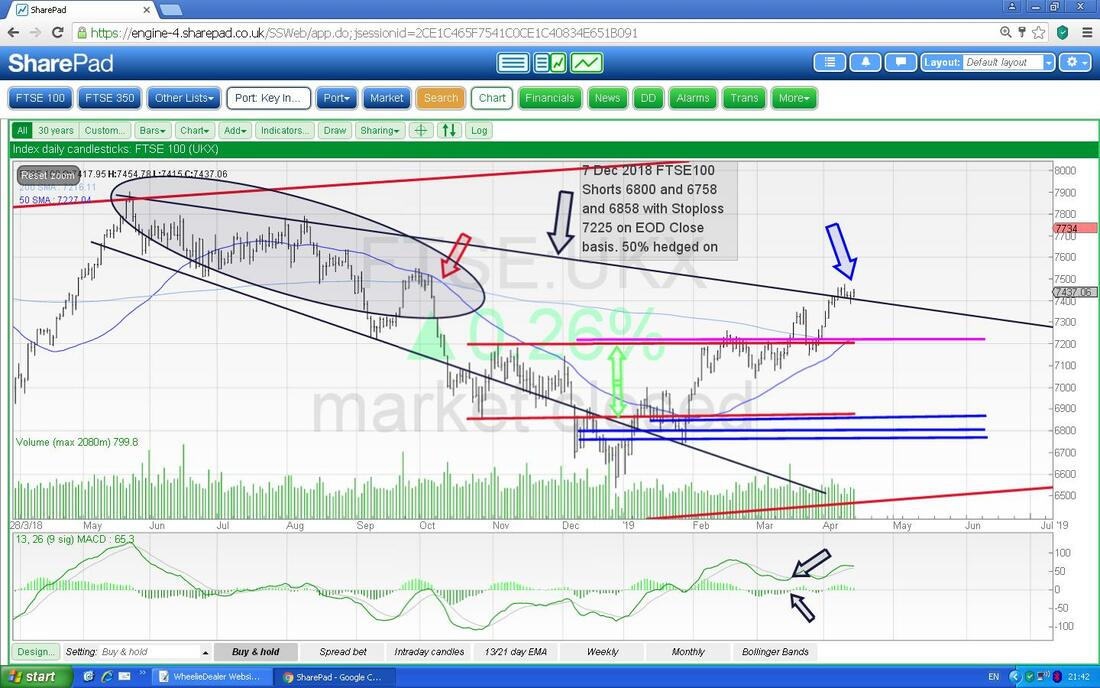
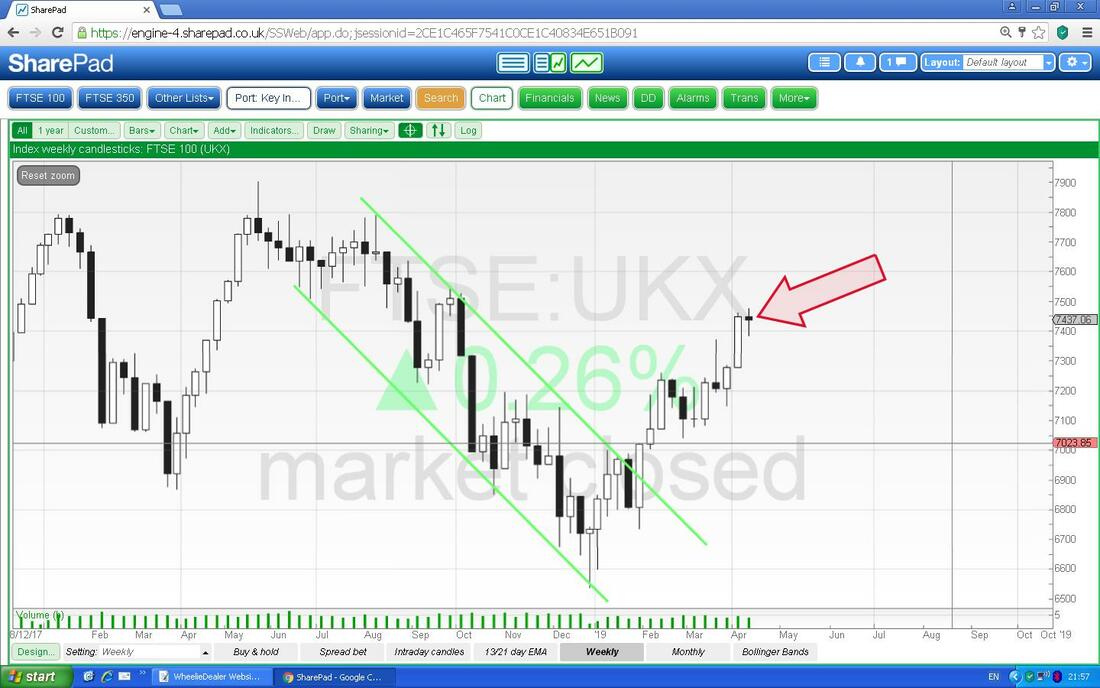
On the next Chart I have zoomed in to about the last 6 Months or so and my Red Ellipse is intended to capture a set of Daily Candlesticks which really seem to be chopping about and going sideways between about 7367 at the bottom and 7477 at the top - it seems likely that how we breakout of this very tight Range will dictate where we go next. For example, if we Break above 7477 on a Daily Closing basis then I would expect more gains and a drop below the Support at 7367 would probably mean more falls.
If you look to the Left, there is a lot of Resistance up to about 7552 as well. 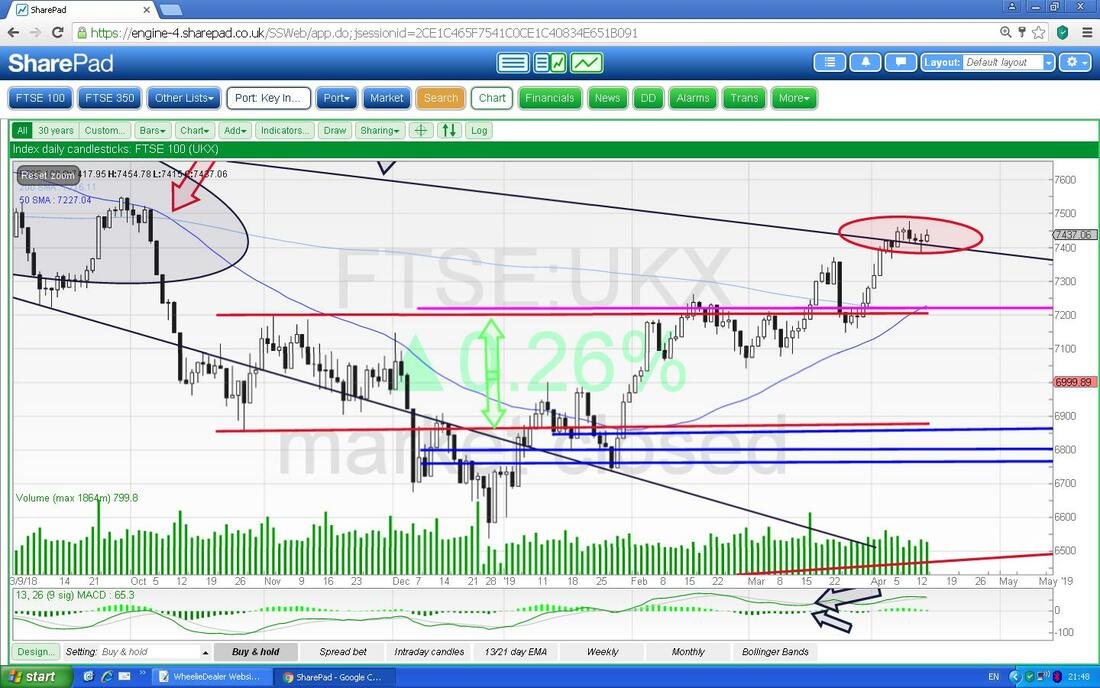
In the bottom window on the next Screen we have the MACD (Moving Average Convergence Divergence) for the FTSE100 Daily and this is the same Screen as I just showed but I have moved up the ‘separator’ between the Windows to show the MACD bigger.
My Black Arrows are intended to show that we are nearing a Bearish MACD Cross on both the ‘Signal Lines’ and ‘Histogram Bar’ formats. I don’t find this a hugely reliable Indicator but it can be of assistance when used with other Technical Analysis (TA) items. 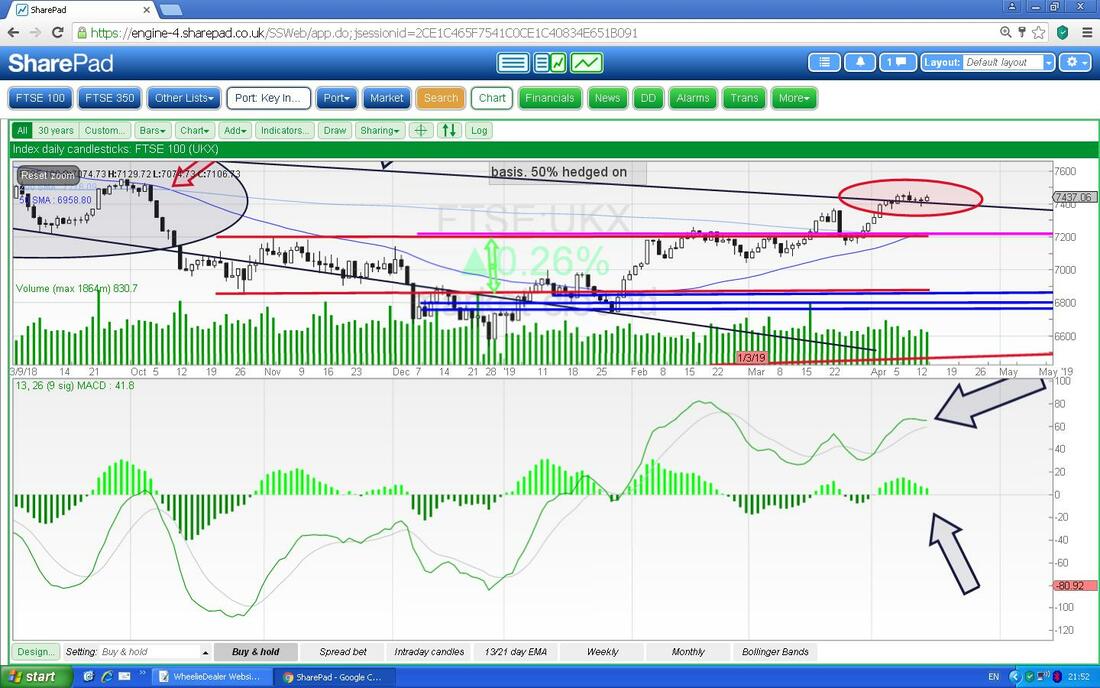
In the bottom window below we have the RSI for the FTSE100 Daily and on a Reading of RSI 65 where my Arrow is, this is a high reading and it is dropping so it might be hard for the FTSE100 to make upwards progress from here in the very short term.
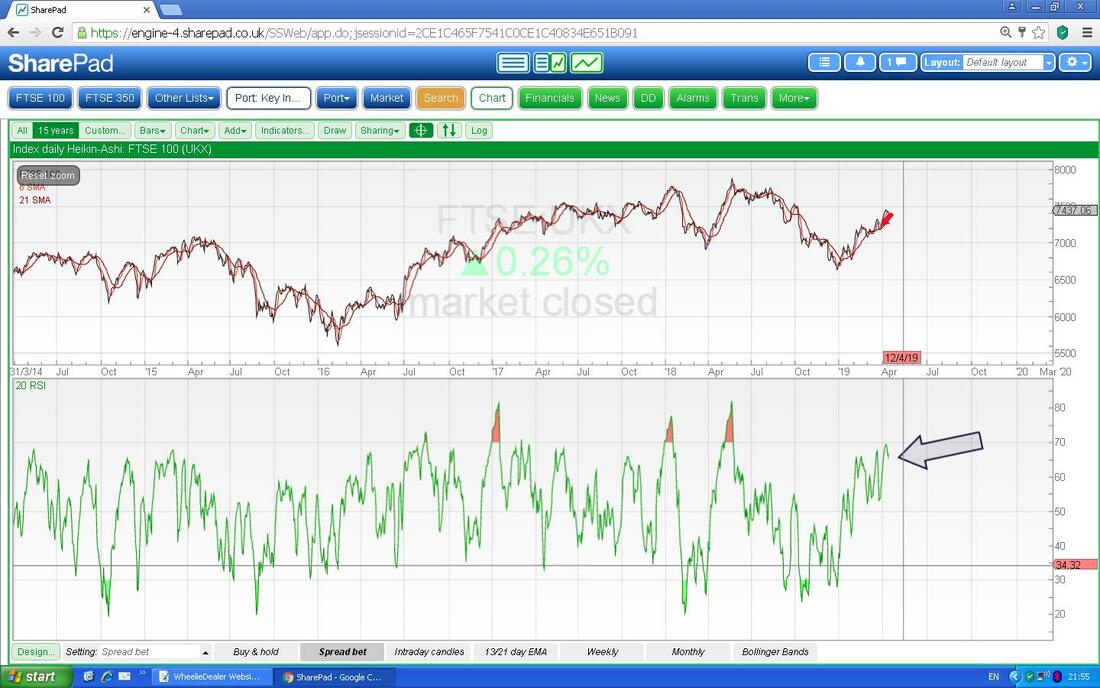
This is more notable. Here we have the Weekly Candles and my Red Arrow is pointing at a ‘Hammer’ Doji sort of Candle from Last Week and in the context of the strong run up, this could mark a Turning Point down. At best it suggests the force of the move up is weakening.
Hostelworld HSW
I hold HSW and it is quite an interesting Chart. The story really has been a strong Downtrend which is shown on my Chart below with the Red Line and then note how it moved sideways out of this Downtrend back in December 2018 and since then it has been mostly moving sideways but just recently it has started to move up and note how it has Closed up above my Green Line at about 218p after a fairly weak Breakout and where my Green Arrow is the Price is pretty much at the 200 Day Moving Average Line (marked by my Blue Arrow) and it looks likely it will go higher. 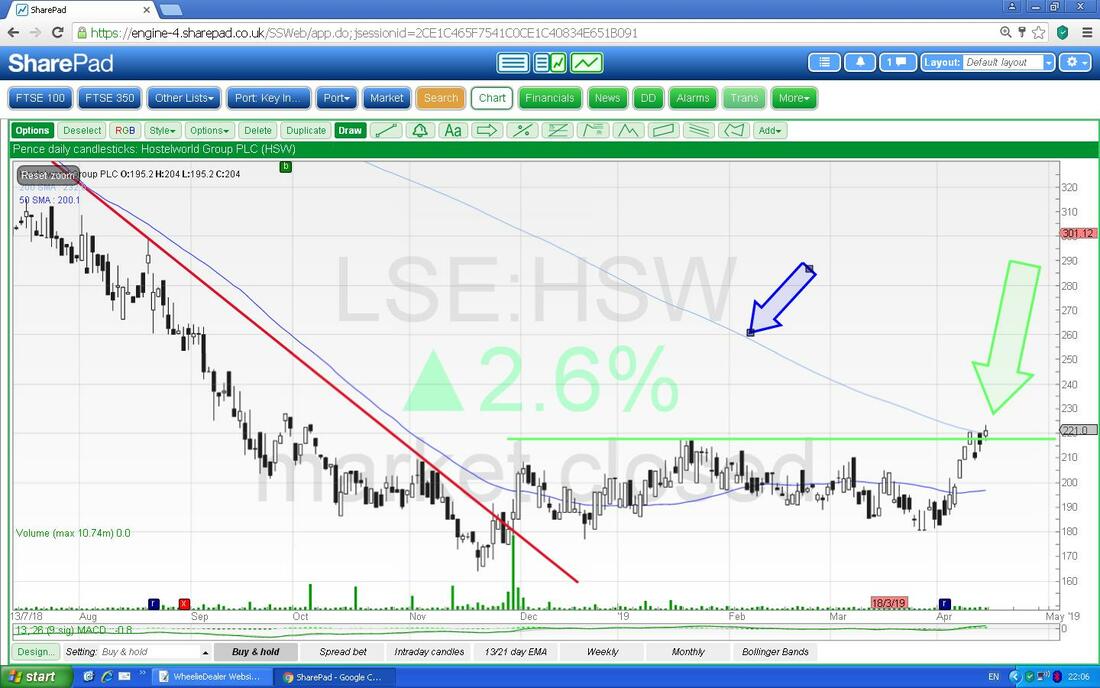
Go Compare GOCO
This one is so similar to HSW with a Downtrend then a Sideways bit and now a Break higher. Again we have a Horizontal Resistance Line in Green and my Green Arrow is showing where it Broke-out higher. This one is likely to gain more from here. I hold GOCO and they are responsible for those awful ‘we flip‘ TV Adverts with the talking chameleon or whatever reptile it is. 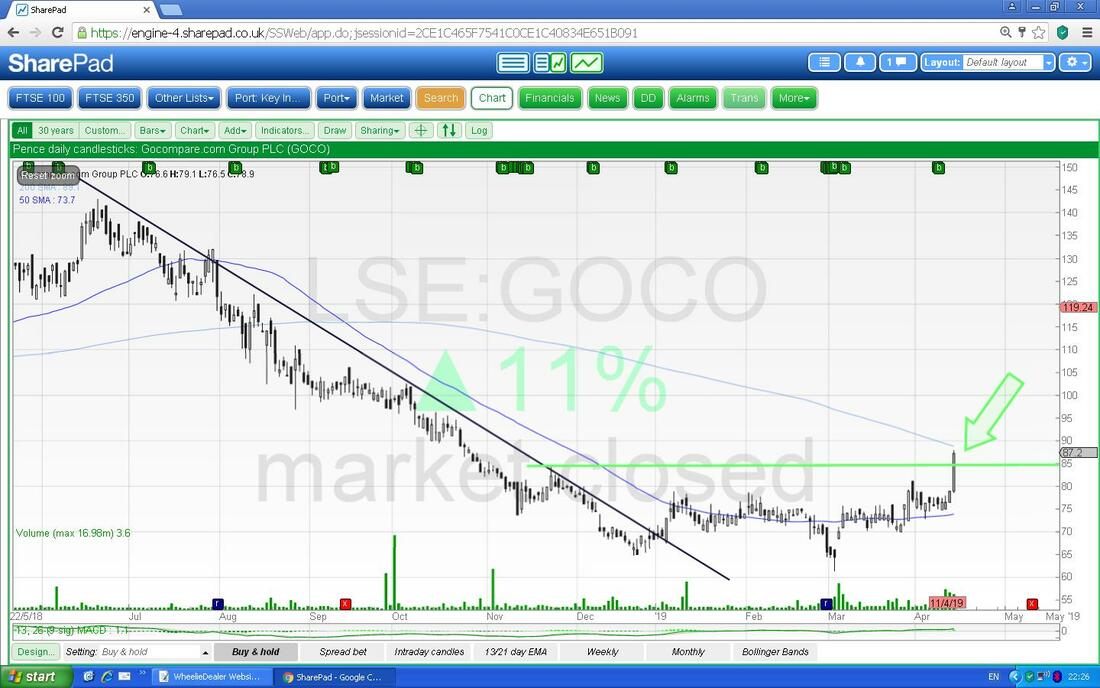
Games Workshop GAW
I don’t hold GAW but it is another interesting Chart and I know a lot of people do have some. The key thing here is the Red Horizontal Line marked by my Red Arrow at 4060p - a Breakout above this would be really bullish (and I suspect it will happen). My Black Arrow is pointing to a strong Up Candle from Friday after very good Results came out and it Closed at 3712p which is not far off that 4060p level. 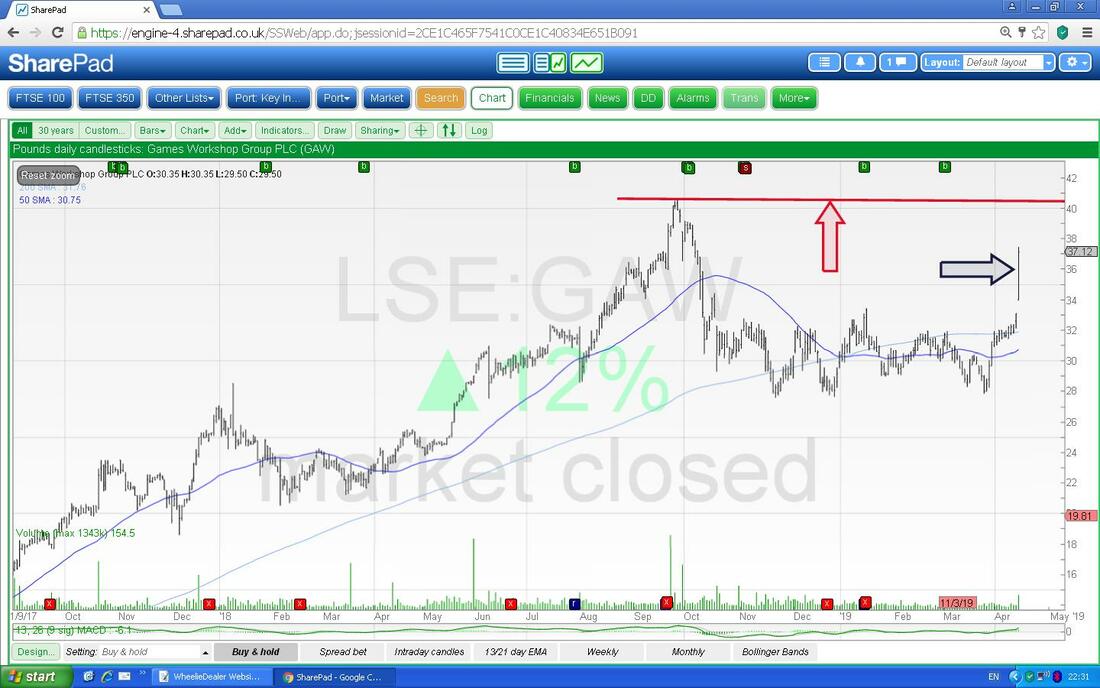
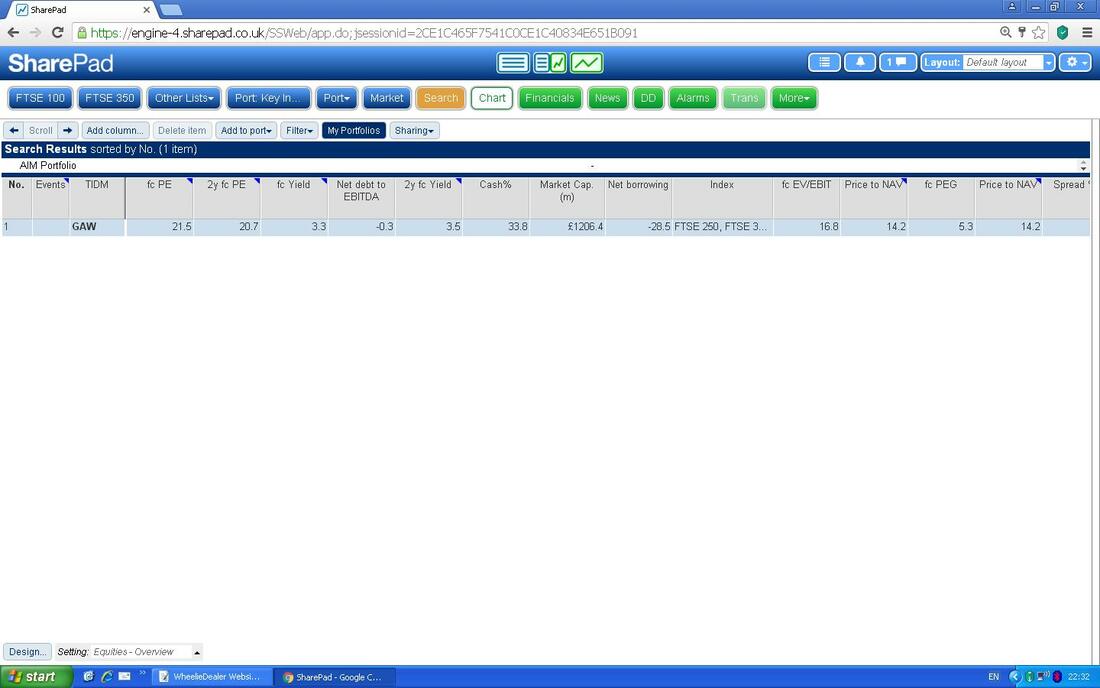
The Screen below has some key numbers for GAW and a Forward P/E of 21.5 is not cheap by any means although GAW does have some Cash. A Forward Dividend of 3.3% is not bad and it is worth appreciating that GAW has a habit of beating expectations. Another 10% up from here to the All Time High would stretch that P/E but I suspect people who continue to hold GAW into next year will probably do very well.
Keywords Studios KWS
Finally I will show you KWS. I don’t hold this one but it is another interesting Chart and seems a very good high growth company although there is risk around the aggressive acquisition strategy. My Green Arrow shows a strong move up on Friday which peaked intraday at 1492p and now my Red Horizontal Line marked by my Red Arrow at 1536p is important Resistance to get over and if it can do this then the Resistance from my Black Line (Black Arrow) at 1640p is next up. This one might be difficult but if it can break through then we should see 1800p and 1900p again. 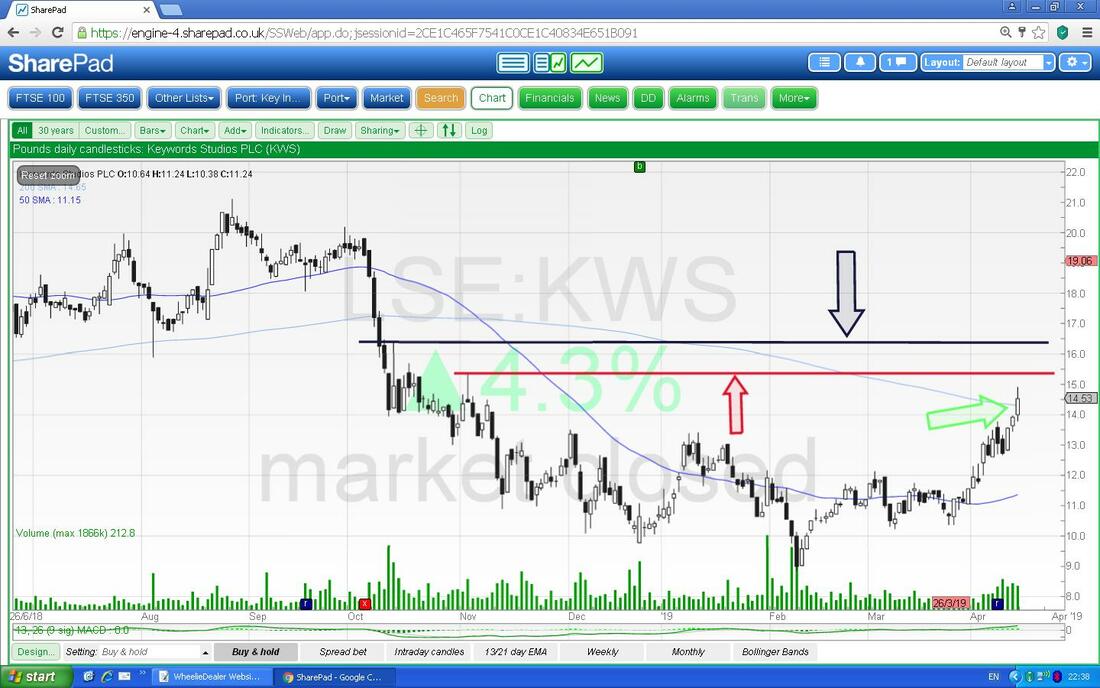
A Forward P/E of 30 as per my Screen below is not cheap but the growth is strong and Gaming is a hot sector.
That’s if for this weekend - I hope everyone has a decent Week. Cheers, WD. 
0 Comments
Leave a Reply. |

Stocks & Markets WheelieBlogsThese tend to be more Markets and Stocks related and timely - the Blog Page on the Main WheelieDealer Website has the 'Educational' stuff (well that's the theory anyway !!). Archives
October 2021
Categories
All
|
