

|
stocks & Markets blog |
|
I don’t have a lot of time tonight as I am intending to go to Silverstone tomorrow for the British Motorcycle Grand Prix and I have spent most of today and yesterday watching the Practice and Qualifying sessions !!!
Last year the Race got cancelled due to terrible weather (Silverstone is not somewhere you want to be in the usual horizontal driving rain you often get there) and I missed out on that so I am dead eager to get there tomorrow and it might be the last chance to ever see Valentino Rossi ‘in the flesh’ as it were. On top of that I feel like having a laid back weekend especially after the recent problems I have had with my hip which hopefully are sorted now but I am still being very careful with it.
Yesterday afternoon Peter @Conkers3 and moi recorded a TPI Podcast which covers a lot on how we see the Markets at the moment and in particular what levels on the FTSE100 etc. to look out for and obviously I go into this in the Charts bit later in this Blog. Anyway, the Podcast should be out in a few days providing that we get no technical grief (believe me, this stuff can happen !!) and I recommend you listen to it and because this Podcast is coming out I am not going to write too much texty stuff about the Markets here. The TPI Podcast will appear in our usual SoundCloud Channel (link just below) and if you are on Twitter then it is highly likely that Peter then myself will be tweeting out a link to it. If you subscribe to the TPI Channel then SoundCloud will notify you when new Podcasts are released.
https://soundcloud.com/user-479955511 Oh, if you are new to the Podcast thing then I recommend you listen to some of the ones we have recorded already because although part of them has a time-specific element, we have lots of general Investing Education type stuff in them so really they are quite evergreen. Just the job when you are sitting in the Bank Holiday sunshine in the Garden with a Beer….(it helps your enjoyment of a TPI Podcast if you are a bit pis*ed). The only thing I will mention about the Markets and Financial System in general is that something seems very, very, wrong to me. I have been hinting at this for a few years in my ‘Weekly Performance’ page comments and I recommend you read this text but the situation has got even more bizarre and it concerns me a lot. It is not normal for me to be so continually Bearish as naturally I am very optimistic and no doubt you need to be fairly positive in general to make money on Stocks but there are too many things making me nervous at the moment such as the Negative Bond Yields, High Gold Price and lots of talk of ongoing Stagnation in global economies. Something just doesn’t seem right and this is making me very cautious. In light of this, as I mention in the Podcast, I am not keen to buy much at all and things I do buy will be more focused on boring, and reliable Income Stock sorts of things – picking up around 5% or more Dividend will be a big help if things get seriously ugly. Last Week I had a lot of luck towards the end of the Week when we got the news of the Entertainment One ETO takeover bid and then later on Friday the Markets went belly up as the Trumpster said some seriously deranged things on Twitter and I swear that guy has the biggest Short in history on the DOW !! I can imagine him sitting there with his Plus500 Spreadbet Account (he wouldn’t have an igindex account because they wouldn’t let him have one !!) and putting on a Short just before he sends out a truly insane Tweet. People think he just watches Fox TV all night but really he is placing Spreadbets and sending out bonkers Tweets. As a result my Portfolio gained 4% on the Week and that is utterly massive and near the top end of the best weeks I have ever had on Stocks. Probably around 1.5% of that was from ETO but even before Friday my Portfolio had been slowly gaining as my Hedges on the FTSE100 and S&P500 did quite well and my Stocks mostly behaved. This pushes my Portfolio back into positive territory for 2019 and of course this doesn’t include my Income Portfolio which is still holding up pretty well so I am very happy with how things are going. I suspect that September and October could be ‘fun’ and we discussed this on the Podcast. If it plays out as I suspect with the FTSE100 highly likely to drop below 7000 and perhaps as low as 6500, then my Hedging Strategy is going to deliver big time and I intend to add another small Short on the S&P500 if I get a good Sell signal soon (I will put on a strict Stoploss as well). The Charts below cover this in more detail. WheelieBash There has been a stunning response to this and we are pretty much fully booked now with officially 61 people on The List. If anyone is desperate to come along then email me or DM me or something and we can probably squeeze you in (on the basis that the Landlord hopefully won’t be counting – or reading this Blog !!). Blog Slate All clouds have silver linings and all that and the upside of my hip troubles is that I have been very productive on the Blogs. I have lots of drafts in various states of completion and no doubt something will be issued this week. At the moment my thinking is that I will issue one about why panicking is a bad thing and ways in which we can minimise its effects and of course with the potential for trouble in coming weeks this is probably quite well timed. I also have many Non-Finance Book Reviews written on various subjects and once I am off the sofa more permanently, I will put effort into publishing these. In the week just gone I published Part 2 of the ‘You can’t time the Markets’ blogs and basically I argue that perhaps you should and maybe you can (and maybe you do without realising it) !! From the Dark Recesses of the WheelieBunker It is tempting to put in another Blog related to the impending doom but I fancy something a bit more ‘light reading’ and so I bring you this one: http://wheeliedealer.weebly.com/educational-blogs/analysing-the-analysts?view=full S&P500 As always the Charts are taken from the exquisite SharePad website jobbie I subscribe too and I always follow the same kinds of Indicators, Signals and Patterns which helps to ‘Keep it simple’. If you click on the images they should get larger in your browser so you can see more detail although I have recently discovered that on a Mobile Fone this is not ideal and it may simply be best to use a PC with a huge screen or at worst use a Tablet. Again like last week I will start with the ‘Big Picture’ and let’s see what my favourite signal thing, the 13/21 Day EMAs are saying. Anyway, no huge shocks on the Chart below and my Black Arrow is pointing out the Bear Cross between the 13 and 21 Day EMA Lines (the Black Line which is the 13 Day EMA is the ‘faster one’) and until we get the opposite sort of Crossover – a Bull Cross – then this Index is likely to mostly keep falling. You can see a Bull Cross where my Green Arrow is and this is what Bulls need to happen now (my hunch is they will be disappointed). 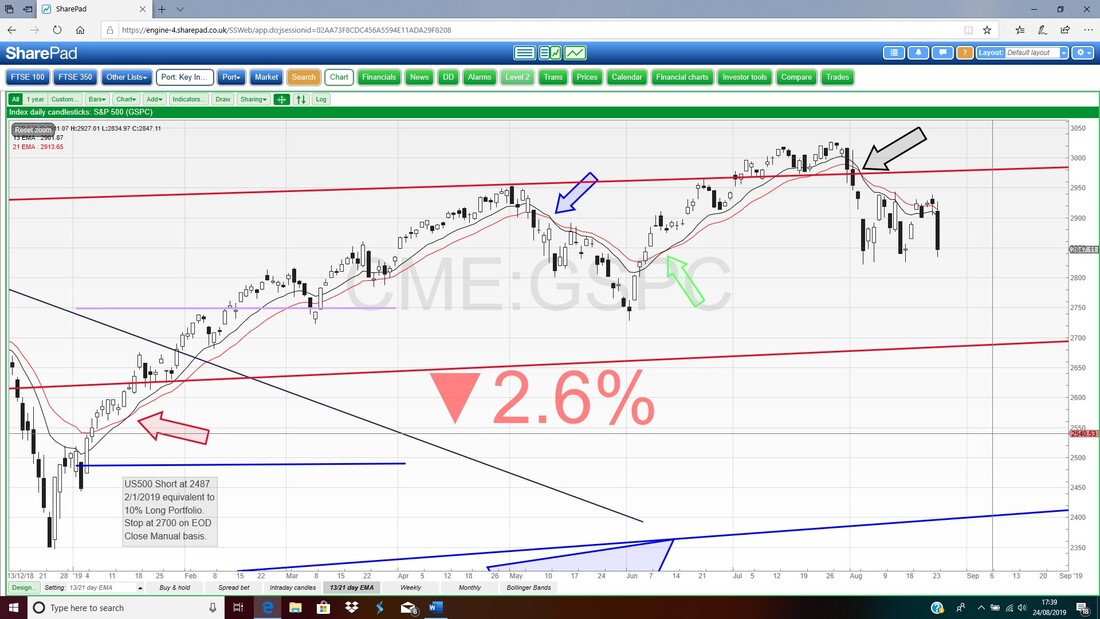
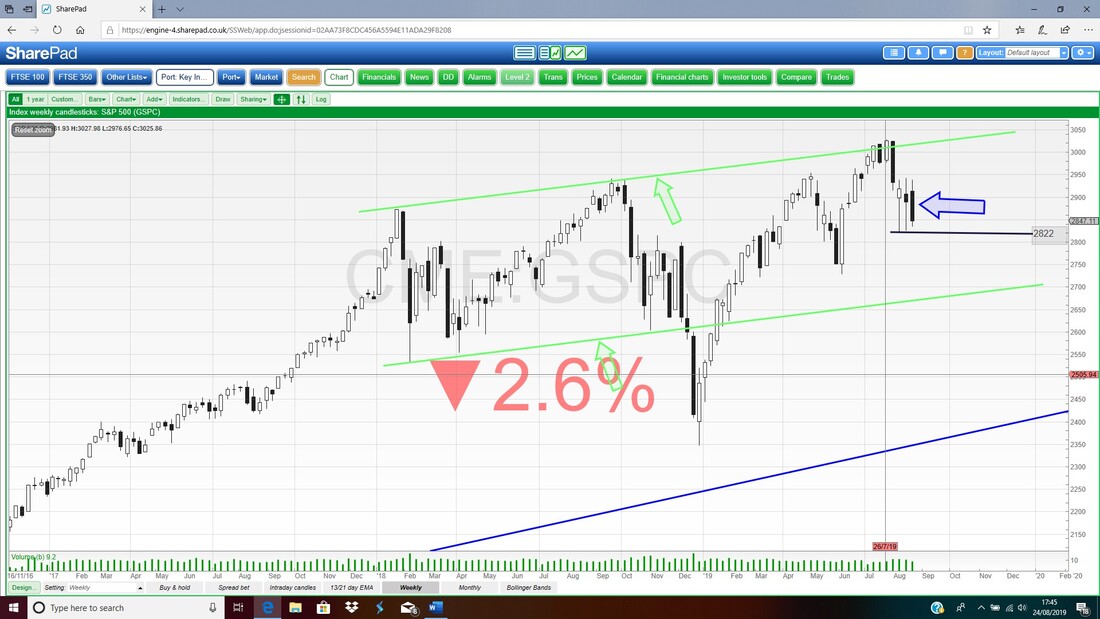
Now the Weekly Candles for the S&P500. My Blue Arrow is pointing to a Big Black Down Candle from Last Week and this looks bearish. Note that in the 2 previous weeks we had ‘Long Tails Dojis’ and after the falls before these that was an attempt by Bulls to ignite a rally but Last Week the Big Down Candle suggests that the Bears have taken over again and the only hope Bulls have now is that they can keep the S&P500 above my Black Line which is marked 2822 (sorry the text is so small but I am still trying to figure out how to use SharePad !!). If 2822 fails that is obviously bad and it means 2728 comes into view.
On my next Chart I am cheating a bit but I want to make Readers aware of what could be about to happen. This Chart has the Monthly Candles for the S&P500 and my Ellipse is capturing a Big Black Down Candle for August but NOTE THIS CANDLE IS NOT YET VALID so I am jumping the gun but if my hunch is right then in a few days we could get a very Bearish Signal.
My Blue Arrow points to a Small Long Tails Doji from July and this turned out to be Bearish as no doubt I would have pointed out in my previous Blogs (you can go back and check !!). We have just 5 Days, 1 Week, left of August and unless there is a huge Rally it looks like we will get a Bearish Candle for August and after a ‘Turning Point’ Candle for July this doesn’t look promising. As a general rule it is important not to read too much into partially built Candles before the full time period is up but we are near the end of August and I am highlighting something to watch out for. 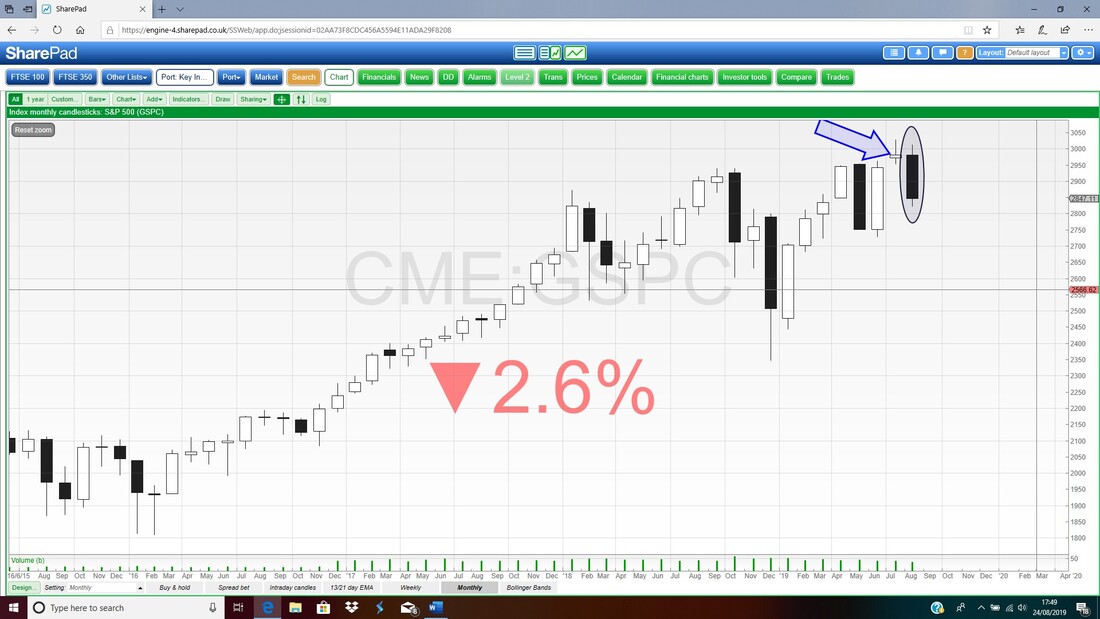
Lot going on here. This is the Daily Candles for the S&P500 and first off look at my Red Arrow which is pointing to a Big Black Down Candle from Friday. Next look straight down below and you should find most of a Black Ellipse which is highlighting a Big Spike in the Green Volume Bar for Friday. This suggests that on a Big Down Day there was a lot of Volume and this shows Bears are pretty active.
Next look at my Blue Arrow and note this is pointing at the Blue Wiggly 50 Day Moving Average Line and this is acting as Resistance. My Black Arrow is pointing to the Horizontal Black Line which is Support and this is that 2822 Level that I mentioned on the Weekly Chart (I think it was that one). Next look at my humungous Green Arrow – that is pointing at the Support which is at 2728 – if that fails then we go down to 2600 perhaps. 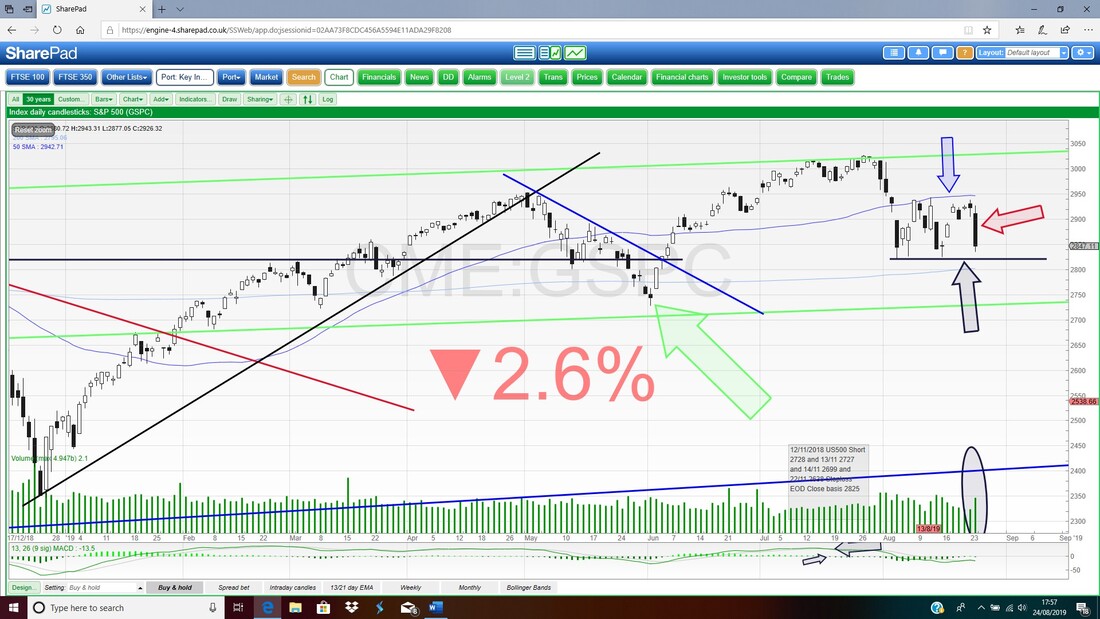
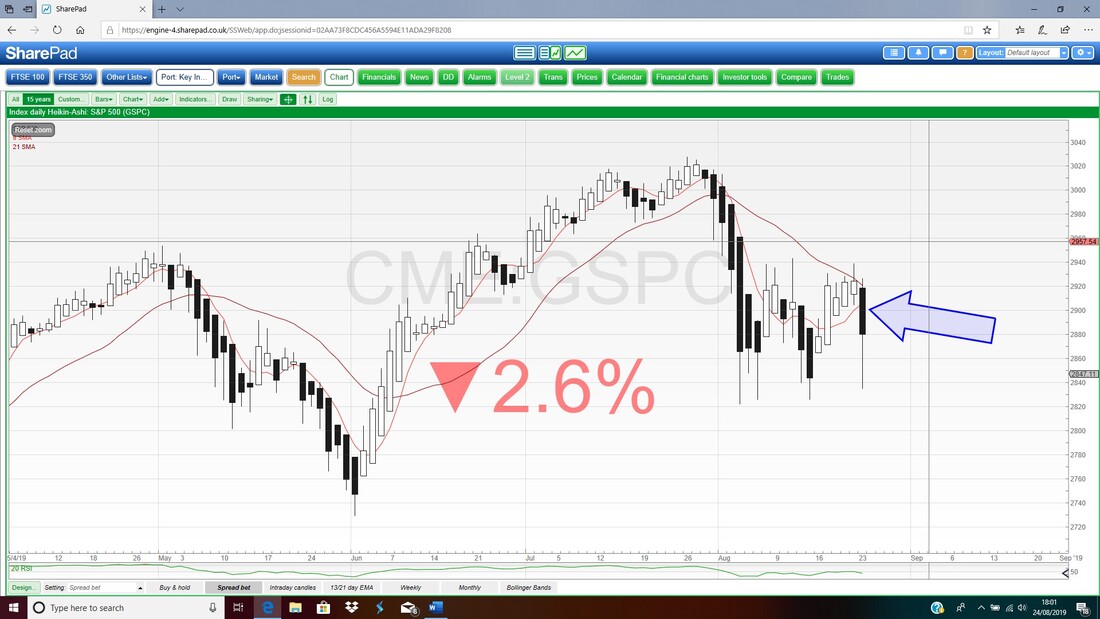
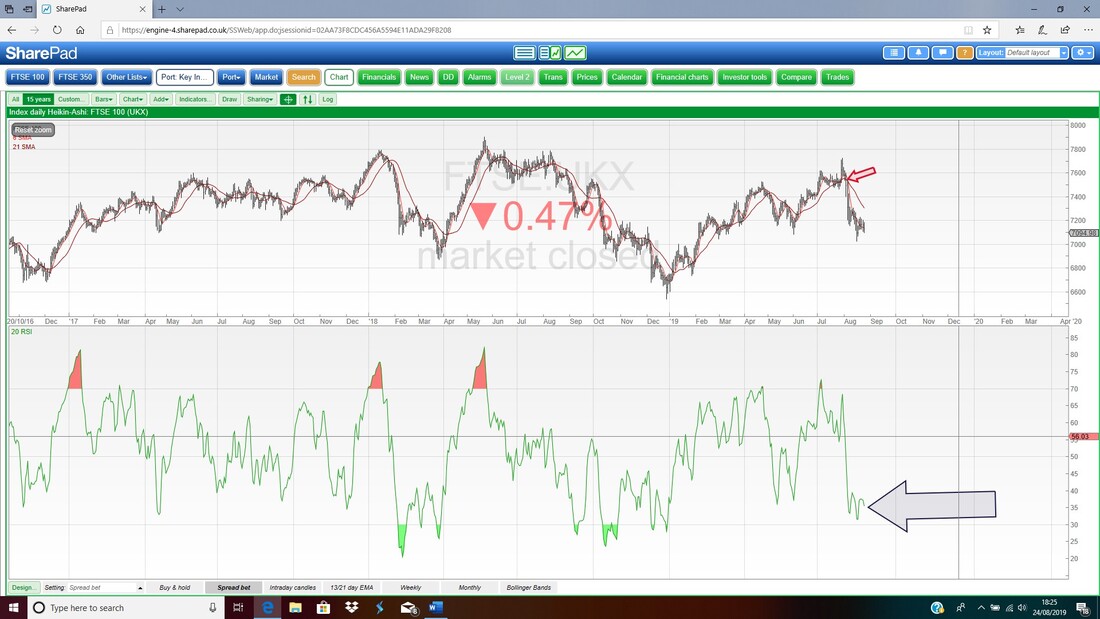
I am just chucking this in because it lines up with previous Charts and if we get more of this then that is bad news. Really the key to everything is that Support at 2822 and if the S&P500 Closes below it then expect the S&P500 to go lower. Anyway, my Blue Arrow is pointing to a Big Black Down Heiken Ashi Candlestick and the way these work that is nasty.
Finally on the S&P500 here are the Daily Candles with the Pink Zone marking the Upper and Lower Bollinger Bands. The Blue and Green Lines are similar to what I showed last Weekend I think but the thing I am pointing out here is that where the Black Arrow is we Closed on Friday up off the Bottom Bollinger Band and this might hint that the Market will try to rally on Monday (there is a common ‘Monday reverses Friday’ thing anyway so it wouldn’t be a huge shock) but as I said before the key thing here is that Support at 2822.
If Bulls suddenly decide to do an impression of Pamplona, then they need to get over the Top Line which is the Blue Line (Blue Arrow) at 2943. Personally I think this is unlikely. 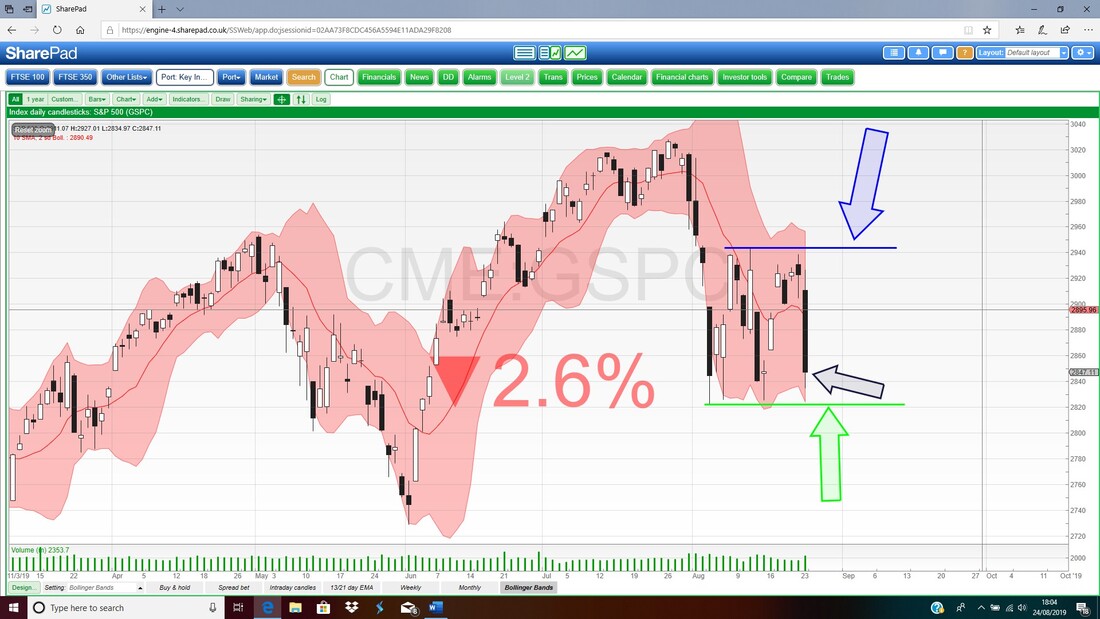
FTSE100
Big Picture stuff again with the 13/21 Day EMAs around the Daily Candles for the FTSE100. My Black Arrow is pointing to the Bear Cross which I have been showing for Weeks and this is still ‘in force’ which suggests the Markets will fall. Note that when in the Bear Mode it means the Major Trend is really down but we can get quite good rallies within this larger Downtrend. However, when the Market tries to rally you find that the 13 and 21 Day EMA Lines start to converge (in other words they start moving closer together). Note at the moment where my Red Arrow is that the Lines are actually DIVERGING (i.e. moving further apart) and this isn’t too good for Bulls. 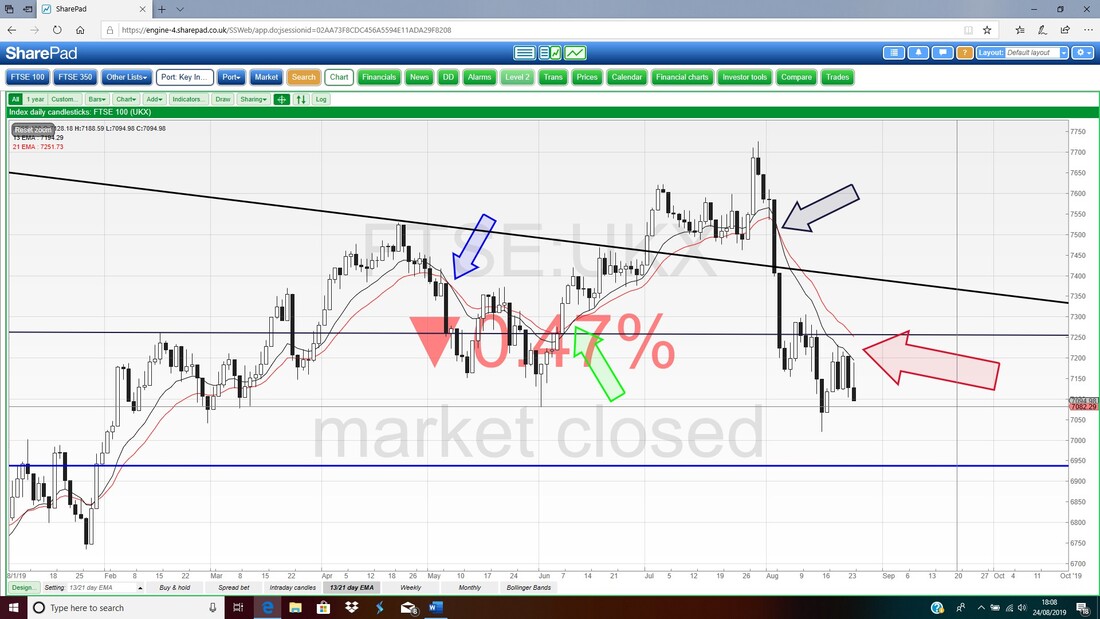
This is an interesting and unusual one. These are the Weekly Candles for the FTSE100 and Last Week (where my Red Arrow is) we had an ‘Inverted Hammer’ which in the context of the 3 previous Big Black Down Weeks actually could mark a Turning Point – i.e. the FTSE100 might try to rally. However, I am not convinced by this and you could interpret this as the FTSE100 being high for most of Last Week but then falling back which is not really all that Bullish. We shall see but the key here is the Support at 7020 (call it 7000 really) and if this fails then we could easily see 6850 then 6700 and worse case 6550. If 6550 fails we really are in the mire.
In the more shorter term, if that Inverted Hammer is to be a Turning Point then next Week the FTSE100 needs to open up at about 7100 and then to put in a nice UP Candle on the Week – if it doesn’t manage this, that is very bad. 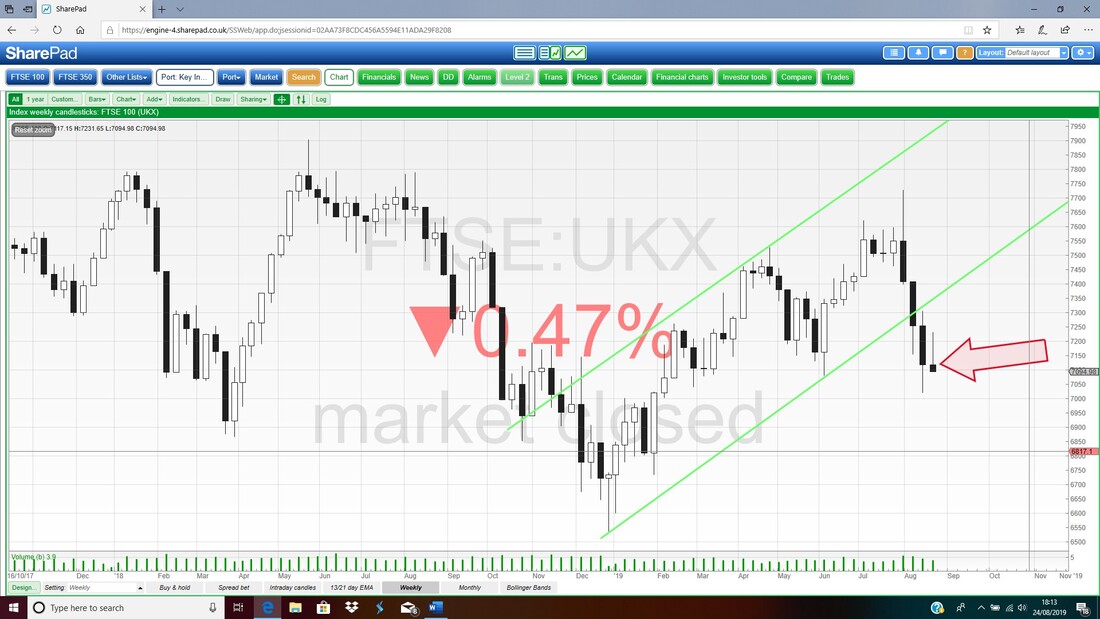
I don’t have a lot of time so I will incorporate a few things on this next Chart. This is the Daily Candles for the FTSE100 with the Pink Zone showing the Upper and Lower Bollingers. My Blue Arrow is pointing to a Down Candle from Friday and note the substantial Reversal which took place during the Day with the Market dropping back at the Close after starting very strongly. The Big ‘Wick’ up above the Candle ‘Body’ shows this Reversal.
Really the FTSE100 is wiggling around and the key thing is that Support at 7020 where my Black Line and Black Arrow are. If that fails then we will get into the 6900s I suspect. I mentioned in the Podcast how this looks like a big Down move, followed by a Sideways Consolidation, which will then lead to another big fall……. Note there is a bit of ‘room’ down to the Bottom Bollinger Band and this is likely to get ‘tested’ next week. 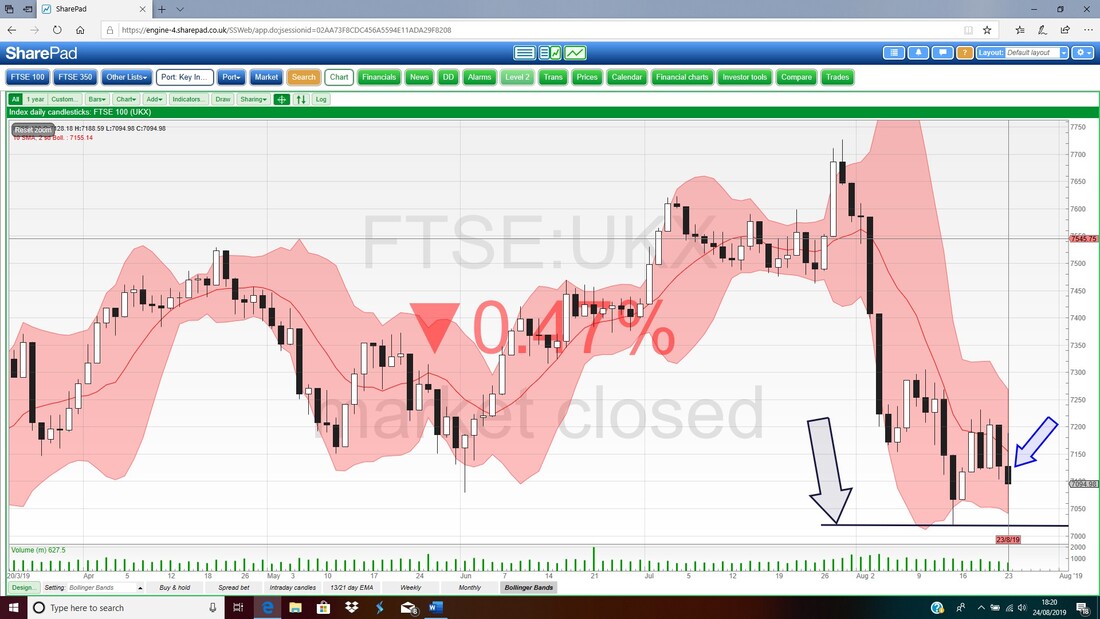
Next up we have the RSI for the FTSE100 Daily in the Bottom Window on the next Chart. Where my Black Arrow is we have a Relative Strength Index reading of RSI 35 which is quite low but the thing to appreciate is that a weak market can put in some very weak RSI readings so it doesn’t mean we will bounce imminently. At some point the Markets will bounce but other Indicators and Patterns which I have shown above suggest that this is not for a while !!
Finishing off, here is the state of the Monthly Chart. Note this is not a full Candlestick for August but like my comments regarding the S&P500 it doesn’t look too clever for Bulls.
OK, that’s shallots, Be careful in these turbulent times !! Cheers, WD. 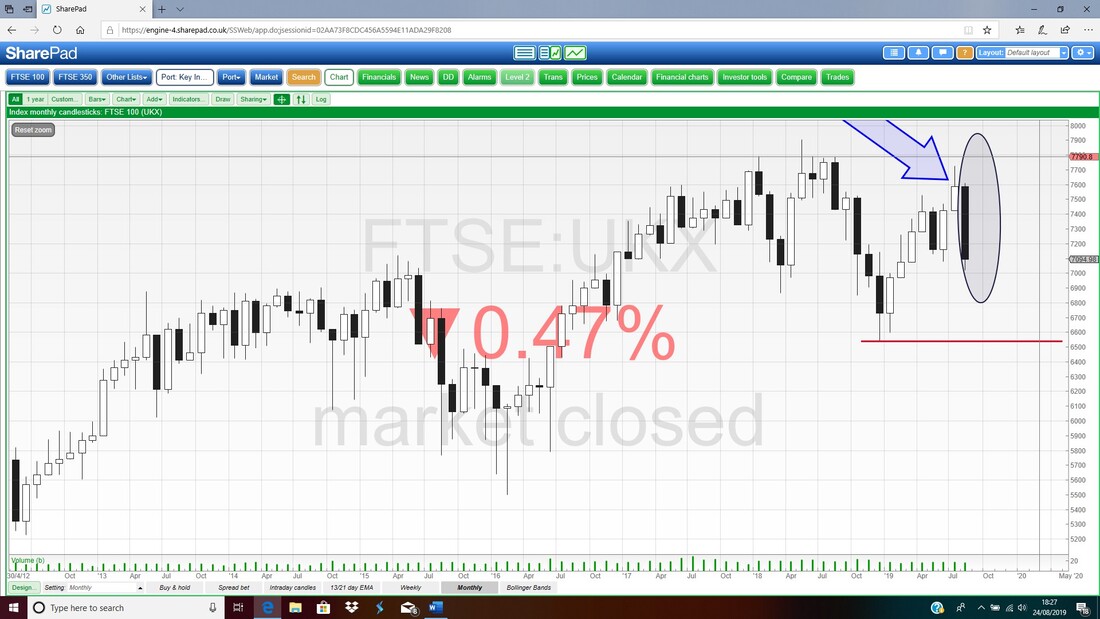
0 Comments
Leave a Reply. |

Stocks & Markets WheelieBlogsThese tend to be more Markets and Stocks related and timely - the Blog Page on the Main WheelieDealer Website has the 'Educational' stuff (well that's the theory anyway !!). Archives
October 2021
Categories
All
|
