

|
stocks & Markets blog |
|
Yet more farce in Parliament on ‘Super Saturday’ then and yet again the Meaningless Vote has been delayed but it is looking like it will reappear somehow in the next few days and one promising outcome from the Letwin ‘Weasel’ Amendment is that it has highlighted the size of the Rebellion against Boris and it looks like the Meaningless Vote will pass.
Clearly if a Deal gets through Parliament then there will be plenty of political theatre from the Opposition Parties who have really been entirely hopeless all round with regards to Brexit (I am sure this is something that both Leavers and Remainers will agree on), but it is a step nearer the Exit Door and even if Brexit does not officially occur on the 31st October, it will pass in a matter of days or weeks afterwards. There could well be a small Extension to get the Legislation technicalities through but the EU is entirely fed up with the ongoing saga and it is unlikely they will allow a longer Extension unless there is a General Election or Referendum – but both look unlikely.
In the coming few days we will probably see an Amendment from Labour (interestingly it will be raised by the backbenches and not by the front-bench) to get a Parliamentary vote on a ‘Confirmatory Referendum’ but I cannot see this really getting far. Firstly it doesn’t look like the numbers are there to get a vote through Parliament and even if it did succeed, Boris will not raise a ‘Money Resolution’ and/or put the full Machinery of Government behind another Referendum so it is dead in the water.
The only way to stop Brexit very soon is a ‘No Confidence’ Vote from Labour and for all their poncing around it is unclear they have the guts as they can clearly see that the Polls are very poor for them and they have managed to upset Remain Voters by their dismal failure to get to a Second Referendum and they have upset Leave Voters with their constant placing of huge hurdles in front of Boris. It is worth noting that this coming Thursday 24th October is the last day when Parliament could be ‘dissolved’ to get a November General Election. This means we will slip towards a December (Christmas) Election but this is actually quite unlikely for Seasonal reasons as much as the dire weather which Political Parties know can hold back their Voters from coming out into the cold to place their ‘X’. So with January and February being in the thick of Winter and with the Spring being historically a time when Parties like to hold General Elections, we might be limping along with the Boris Zombie Government for a long time yet. It is ridiculous really but I suspect that is the simple reality. This would also suit Labour because with their lack of clarity and huge intra-party divisions over Brexit, it would probably be advantageous for them to stand for Election once Brexit is done and dusted and they can hope Voters will have very short memories. Their Brexit ‘Offer’ at this point could be that the Withdrawal Agreement is done and the UK has left the EU but they will negotiate a closer Future Partnership with the EU and if the voters are daft enough, they might fall for this. So my expectation is that MV4 will get through Parliament in the next few days and this will be positive for Markets because they will see a resolution of a long-running sore and it provides a bit more certainty although of course there are many months of discussions about details of the Future Relationship between the UK and the EU to decide, but the main decision about whether or not Brexit happens will have been resolved. As a result I would expect the Pound to continue to gain ground and this might hold back the FTSE100 but help the FTSE250. With the way my Portfolio is positioned this should be quite good for me with my FTSE100 Shorts quite small now and if the FTSE100 manages to drop, then I will benefit from the Shorts. I also have an S&P500 Short but I Closed most of that earlier last week (see my ‘Trades’ page) and if the US Markets rise then the drag will be small and I suspect there will be plenty of sizeable Pullbacks in coming months which will give me an opportunity to Close the Shorts. There are just two weeks left in October now and what has historically been a tough Month in terms of volatility (although on average October has tended to rise) has not been too bad. With November and December being very much in the stronger Winter period for Stockmarkets, the chances favour more upside as we head towards the end of 2019 and with my Shorts now very small and with the Risks around Brexit reducing, I feel happy with my Positioning. I am looking at some Shares to buy and the one I am writing a Blog about will probably be bought soon. I am a bit miffed that Hotel Chocolat HOTC has moved up a fair bit since my Blog as I have not bought in yet and I might buy a small amount of these soon so I am at least ‘in the game’ as I think it can do really well long term and I would like to build a Position. I also looked very closely at Ixico IXI which strikes me as a very good Short-term Buy but I do sense risk around a few issues such as the Management and how it came into being on the Markets. I was very close to buying it but I have decided that in light of the Cash I have available and the ‘Slots’ I have in my Portfolio, I would rather not buy something that is untested like IXI and would rather buy a more established Stock where the Risks are lower and I get a nice Dividend. I am not saying IXI is a ‘bad’ business and I suspect that people who are in it will do very well (and Readers might find it time well spent investigating it), but for me personally, it does not fit my requirements at this time. I also have a lot of exposure to Health related stuff anyway. Last Week Turned out a very tasty week for me and I am well pleased with the gains. My Portfolio added 1.6% which is a really decent performance in light of the recent sogginess and as I mentioned above, I feel well placed going forwards – with both a bias towards more Upside but also with a degree of Downside protection from the Shorts. There is no doubt the general pick up in FTSE250 and Smaller Stocks helped my Portfolio and a bit of weakness in the FTSE100 helped on the Shorts and the US was stronger but I reduced the size of the Shorts before reaching the Stoploss Level and I took a fairly small and controlled hit to my Portfolio on Closing them but it is better that way than to let the Hedges run which I have found out to my cost and much angst. Fingers crossed, a bit more positivity will get my Portfolio back into Profit for 2019 and I will be very happy to get out of 2019 in an ok shape as the Risks this year have been immense. There are still many clouds around in the Global Economy with China coming out with poor GDP figures and Europe is looking quite sick. My hunch is we will see more upside in coming months but as we go into 2020 we could see things get a bit more wobbly in the Markets. Mello Chiswick – November 12/13 The next Mello Event is due to take place on Tuesday 12th November and Wednesday the 13th in Chiswick. I intend to be there on the Tuesday afternoon and into the evening and there is a Discount Code going around where you can get Tickets for half price if you are quick – the Code is ML1950 and you can book at the link below. If you find the Code doesn’t work, then email me on [email protected] or Tweet me or something and I will see if I can get a Code for you: https://melloevents.com/event/ These are without doubt the best Investor Events around and well worth attending. There are usually loads of decent Companies with stands and presenting and it is a superb opportunity to meet up with other Private Investors who are serious about Stocks. Blog Slate Last week I published a Guest Blog from Michael Taylor (@shiftingshares on the Tweets) and that is a very good read about how to find Multi-bagger Shares. It was really helpful of Michael to send me this text as it freed me up to work on the Stock Blog and I have made excellent progress and I feel fairly confident that I can issue Part 1 of the Blogs later this week (knowing how things play out it will likely be Thursday night) and that Part will most likely be quite lengthy and Part 2 will be much more focused on the Numbers and the Valuation and suchlike. I am totally focused on this Stock Blog at the moment and I have not given much thought to what Blogs I will write next. I have a stack of ideas so no doubt I will alight upon something although I must say I have quite enjoyed doing a Stock Blog again and I am perhaps going to start on something for my Income Portfolio soon. There will probably be a TPI Podcast Recording in the pipeline as well. Living in the Past I have had a trawl through the ‘Blog Index List’ which sits on WD2 (the website you are reading this on !!) and the following Blog tickled my bits and this is such an important concept and something I recommend all Investors take on board. As usual there is a link at the start to Part 1: http://wheeliedealer.weebly.com/educational-blogs/price-vs-value-think-like-an-owner-part-2-of-2 TPI Podcasts on Apple & Audioboom Peter @Conkers3 has done a superb job of getting the 3 most recent TPI Podcasts onto the Apple and Audioboom platforms and if you use these as your preferred way to listen to Podcasts then I suspect you will be very pleased with his efforts. It is a bit of a faff to upload each Podcast File and as a result we have decided not to spend time going all the way through the back catalogue (you can find all of these on SoundCloud) but from now on all new TPI Podcasts will appear simultaneously on SoundCloud, Apple and Audioboom when they are released. We have had lots of requests for this and it has taken a while to figure it out and we decided that the most efficient way to do this was to use the ‘Conkers Corner’ Channel that Peter @Conkers3 already has – so if you go to his Channel you should be able to find the TPI Podcasts very easily. I do not have Audioboom or Apple Accounts but I did a search using ‘Conkers Corner on Apple’ and ‘Conkers Corner on Audioboom’ and it came up easily using my laptop browser. Shout if you get problems but it should be straightforward. If you want to listen to the Podcasts on SoundCloud then there are links on the ‘Podcasts’ page which is on WD2 (the website you are reading this on). Time for the Charts…….. S&P500 As always with my Weekend Blogs, the Charts are taken as ScreenGrabs from the superb SharePad software that I subscribe to and if you click on the images they should get a bit larger on your screen so you can see more details. Starting with the ‘Big Picture’ here is the Weekly Candlestick Chart for the S&P500 and my Blue Arrow is pointing to an Up Candle from last week but note it fell back from the High of the week which was up at 3008 (call that 3000 then !!). Note how it failed to get up to the All Time Highs which are encapsulated in my Red Ellipse and this shows some hesitation. It is hard to know what is going on here but if anything this is still a Bullish Chart. We might get some sort of pullback but that would be nothing more than a healthy shaking out of the Bears. There is a ‘Ladder’ of Support below with levels like 2892, 2855, 2822 standing out. 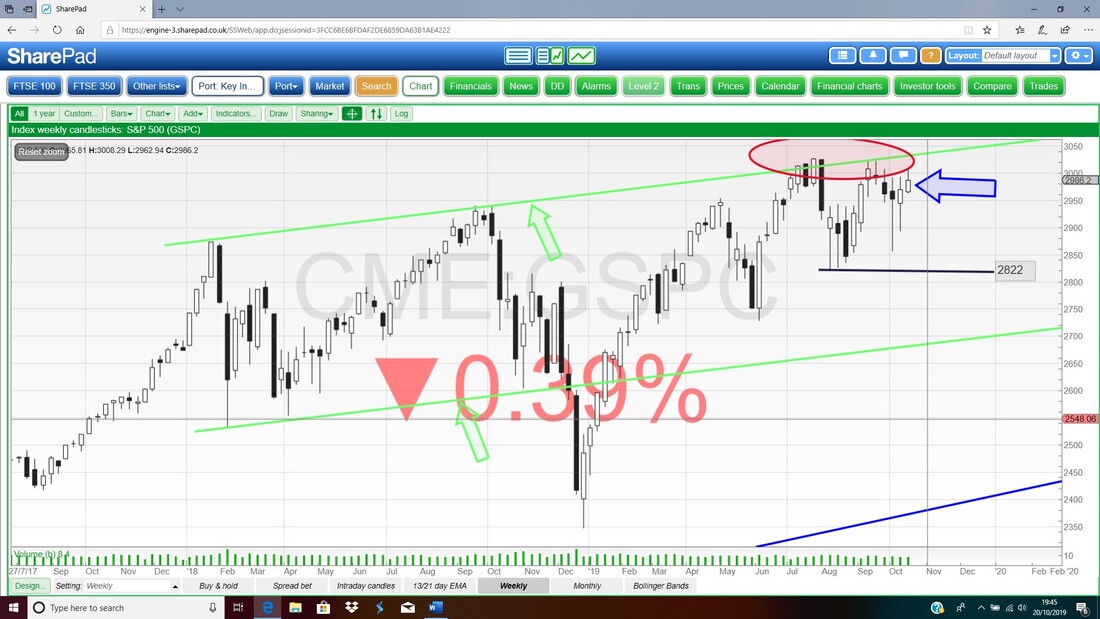
Next up we have the Daily Candlesticks for the S&P500 but my focus here is purely on how the 13 and 21 Day Exponential Moving Average (EMA) Lines are moving. Where my Blue Arrow is we have been treated to a ‘Bull Cross’ where the Black 13 Day EMA Line has crossed up through the Red 21 Day EMA Line and this suggests weeks of upside ahead. If you look to the left you should be able to see my Green Arrow where a similar Bull Cross happened and that led to a lot of gains.
It is interesting that the Red Arrow which shows a ‘Bear Cross’ resulted in a bit of weakness but not much – that is actually quite unusual as I find these Crosses are very reliable and often are very predictive for coming weeks. It was the Bull Cross in recent days that was a major part in my decision to Close part of my S&P500 Shorts. 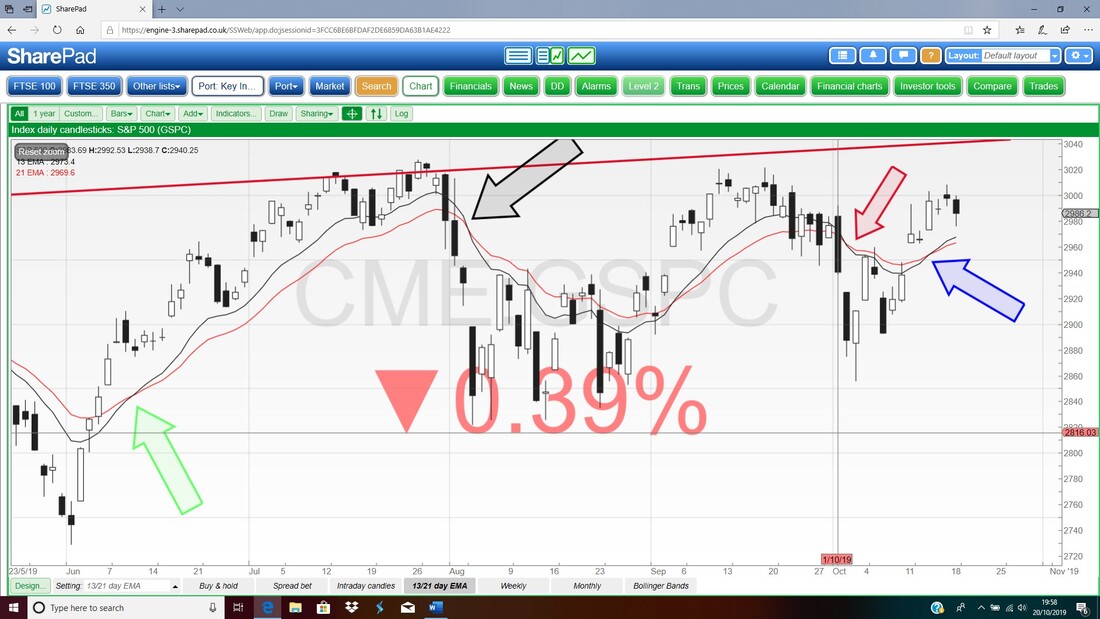
In the bottom window on the Screen below we have the Relative Strength Index (RSI) for the S&P500 Daily. Where my Black Arrow is we have a Reading of RSI 55 which is a little bit above the ‘Neutral’ 50 Level. This doesn’t really tell us a whole lot and I find the extremes are more useful – i.e. when the RSI suggests an Instrument is ‘Overbought’ with a very high RSI Reading or ‘Oversold’ with a very low RSI Reading.
‘Divergences’ can be helpful on the RSI – for example if the Price Line has been rising but the RSI has a Downwards Slope, then these are ‘Diverging’ and it suggests the Rally does not have legs. 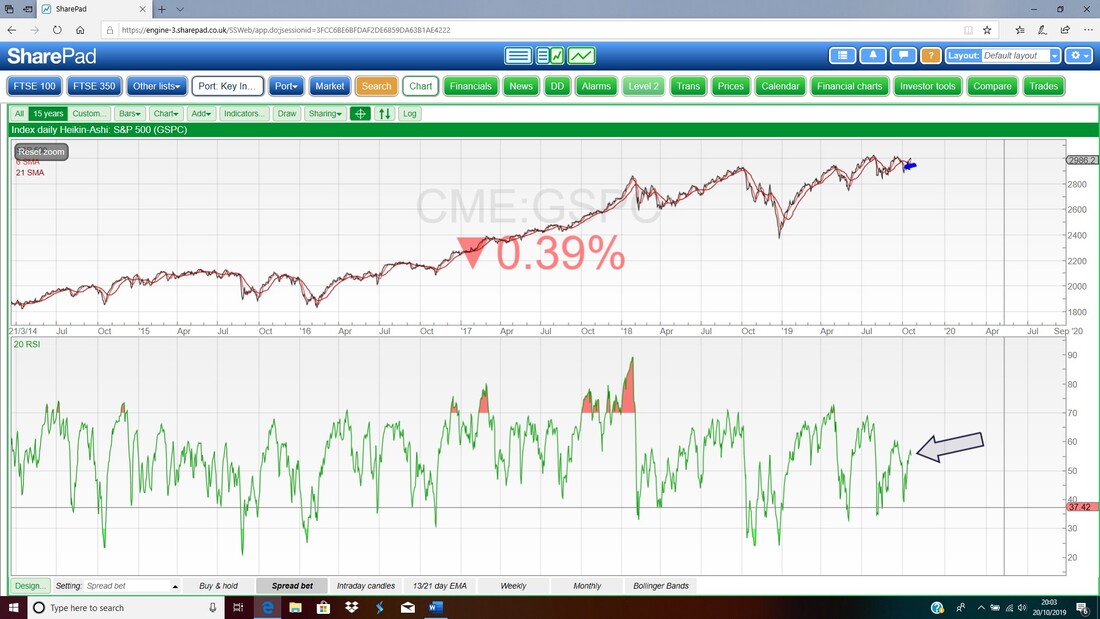
Finally on the S&P500, we have the Daily Candles with the Pink Zone marking the Upper and Lower Bollinger Bands. My Black Arrow is pointing to the Down Candle from Friday and note how this has turned down from the Narrow Body Doji Candle from Thursday (that is quite ‘textbook’) but it is also worth noting that the Close on Friday was well off the Low which was at 2976. It is also clear that the Price is dropping away from the Upper Bollinger Band.
To the Upside, the All Time Highs are captured in my 2 Black Ellipses which show a couple of Reversal Candles and this is up at 3021. If the S&P500 can Close above 3021 that would suggest more upside. To the Downside, there is Support at 2963 which comes from the Candle 6 Days ago (11th October) and it is notable there is a ‘Gap’ before this Candle which the S&P500 might like to drop back into at some point. The Blue Line with the Blue Arrow and the Green Line with the Green Arrow are from a Sideways Range that was in play some time ago between about 2800 to 2950 and this should be quite a strong Band of Support and I suspect if we do see some weakness in coming sessions, then it might drop back and test the Blue Line but then rally again. Obviously dropping below the Green Support Line would mean things are getting rather ugly !! 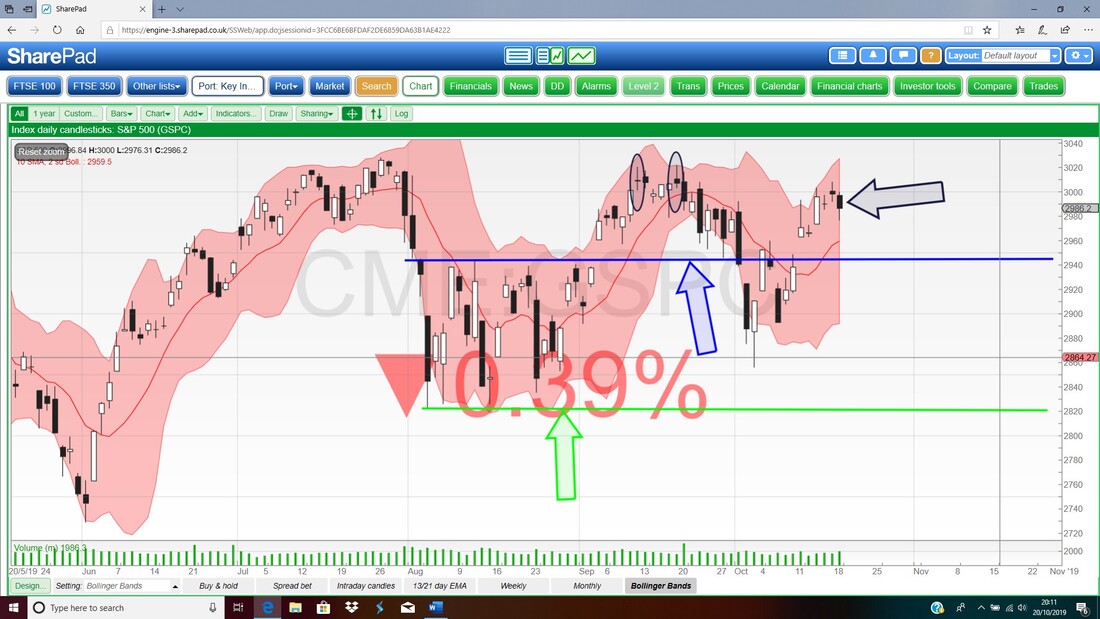
FTSE100
Starting with the ‘Big Piccie’ again, here are the Weekly Candles for the FTSE100 and I have done an experiment with a thing called a ‘Multi-Segment Line’ which I found under the ‘Draw’ Menu on SharePad. It is quite easy to use and you click to start your Line and then every further click it starts a new Straight Line – it is pretty good but probably takes a while to get really talented with it (clearly I am not !!). Anyway, the result is the Red Arc thing at the top which I have pointed at with my Red Arrow and I am trying to show what could be a ‘Rolling Top’ Pattern which would be Bearish. My Black Arrow shows a sizeable Down Candle from last week and note how it ‘Engulfed’ the Candle from the week before mostly and this suggests weakness and more downside. This makes sense when we think about the Fundamentals with a likely Brexit Deal and a Pound that could rise and put pressure on the FTSE100 (see my text that started this Blog). Note how the Price Candles ‘hugged’ the Green Line (marked by my Green Arrow) which was the Bottom Line of an Uptrend Channel that was in place for a while. That is technically ‘good’ behaviour because it is the classic thing where former Support from the Bottom of the Uptrend Channel has started acting as Resistance now. Remember former Support becomes Resistance and vice-versa. To the Downside now we are looking at Support from 7004 (might as well call it 7000) and if this fails we could visit 6850, 6700 etc. To the Upside, there is now clear Resistance at 7440 which comes from 4 Weeks ago and if that gets cracked, we could see 7600 and just over 7700 being visited. I suspect this is some way off !! 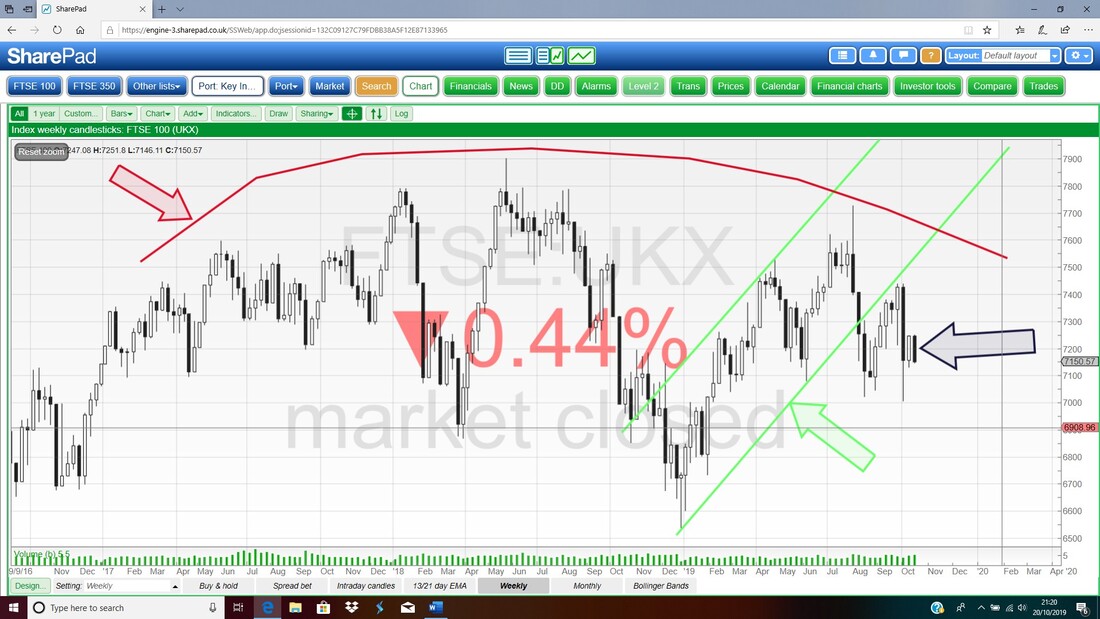
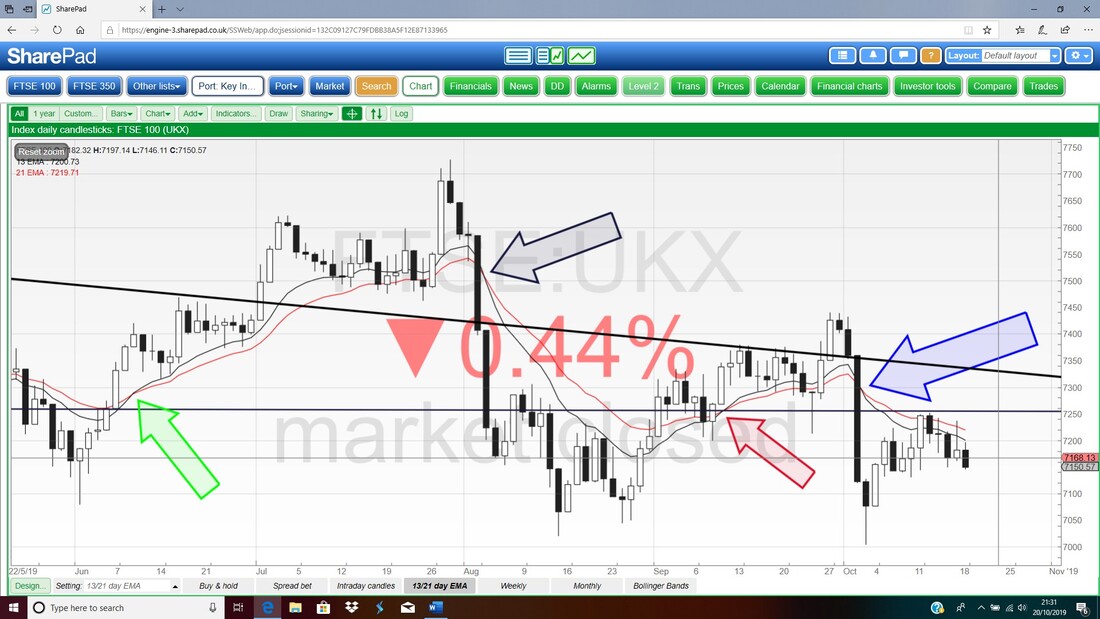
Next we have the Daily Candles for the FTSE100 but on this one I really am focused on the 13 and 21 Day EMA Lines. Where my Blue Arrow is we had a 13/21 Day EMA ‘Bear Cross’ (this is the opposite of what we saw on the S&P500) and this suggests more weakness ahead. If you look at what happened at the Black Arrow, you can see the possible future. Of course such things are never perfect predictors but I find these 13/21 Day EMA Crosses are very high reliability.
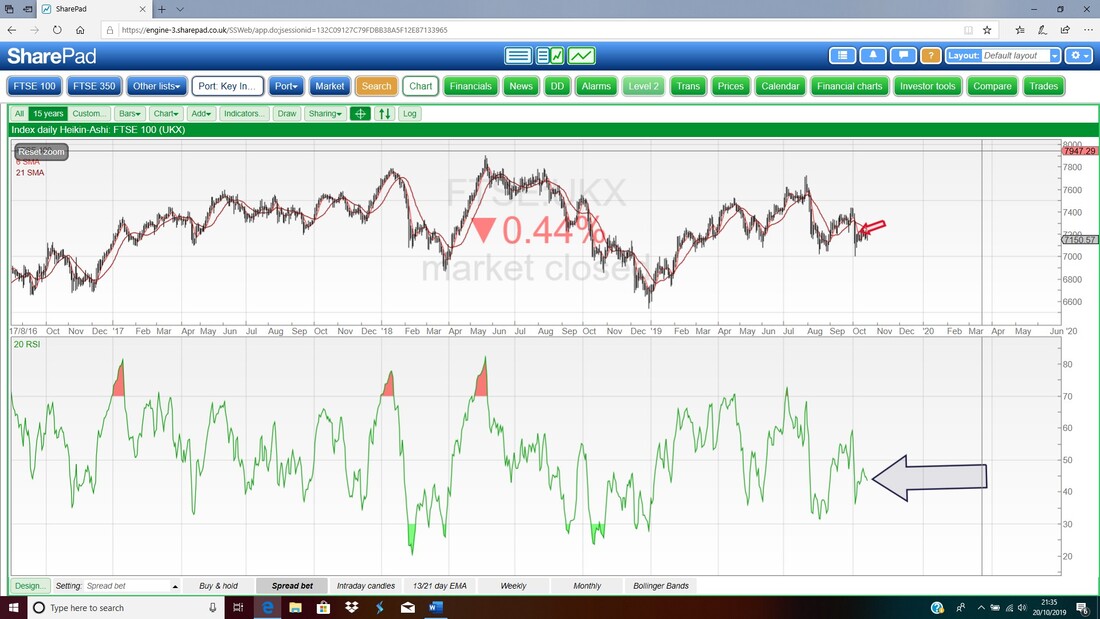
In the bottom window on the next Image we have the RSI for the FTSE100 Daily. On a Reading of RSI 43 where my Black Arrow is this is a bit off the Neutral 50 Level but not Oversold by any means. So it has ‘room’ to fall more if it wants to.
Finally for the FTSE100 we have the Daily Candles with the Pink Zone marking the Upper and Lower Bollinger Bands. If you look at my Blue Arrow that is pointing to a Down Candle from Friday and note how it is a Continuation of the Bearish Reversal which must have happened on the Day before (Thursday obviously !!) where we have a sort of Upside-down Hammer Shape Candle which in this context is not a Reversal Candle as such but it just tells us that Bulls were unable to hold the Highs and the Bears were out on Friday as well.
Note that the Bottom Bollinger Band is not far below where we Closed on Friday at about 7125 and it is possible that the Price finds some Support here. In a bigger view, my Black Arrow marks an important Support Line at about 7000 and higher up my Green Arrow marks a Resistance Line at about 7450. This is clearly a Range to watch and if it breaks below 7000 we are in the doggy do and if it breaks above 7450 then Bulls will be partying. 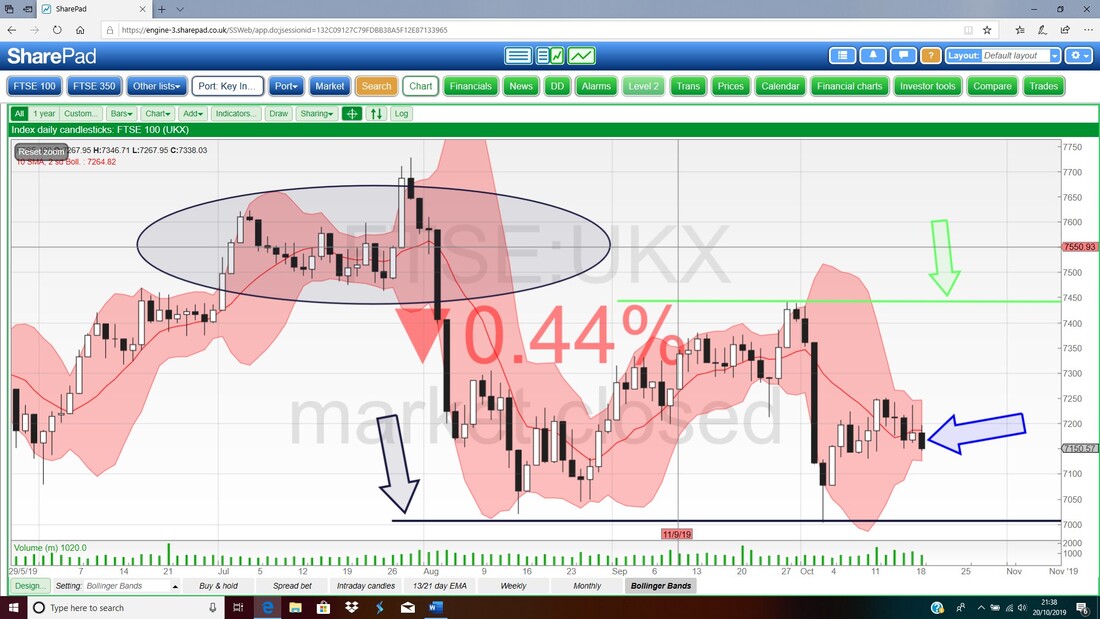
FTSE250
I don’t want to dwell on the FTSE250 for time reasons but I will just chuck a Chart or two in. If you are new to reading my Weekend Blogs you might be interested to know that I tend to put out a series of Tweets (on Twitter obviously but you can see a Twitter Feed on the Homepage of my Websites and on some other pages as well), usually around 10pm where I go through the Index Charts and flag what I am seeing. If you are rather befuddled by the Candles and want to know more, then if you go to ‘Wheelie’s Bookshop’ you should be able to find a Link to ‘Candlestick Charting for Dummies’ which doesn’t cost much and is an excellent investment. It is simple to understand as the title suggests !! Starting off we have the Weekly Candles for the FTSE250 and my Blue Arrow is marking a White Up Candle for last week but note how it has very long ‘Tails’ or ‘Wicks’ which shows some choppiness. On the whole this looks Bullish to me but it is worth nothing the FTSE250 struggled up near 20500 last week and it needs to break this level to go higher. I guess the Choppiness could be explained by the Brexit shenanigans last week. My Green Arrow is marking an Uptrend Support Line which I have drawn in and the Green Line up above is a ‘guess’ at a Top Line for an Uptrend Channel. I have said it is a ‘guess’ because there are not many ‘Touch Points’ and I will amend the position of this Upper Line as the story develops. Clearly the bottom Green Line is important Support. 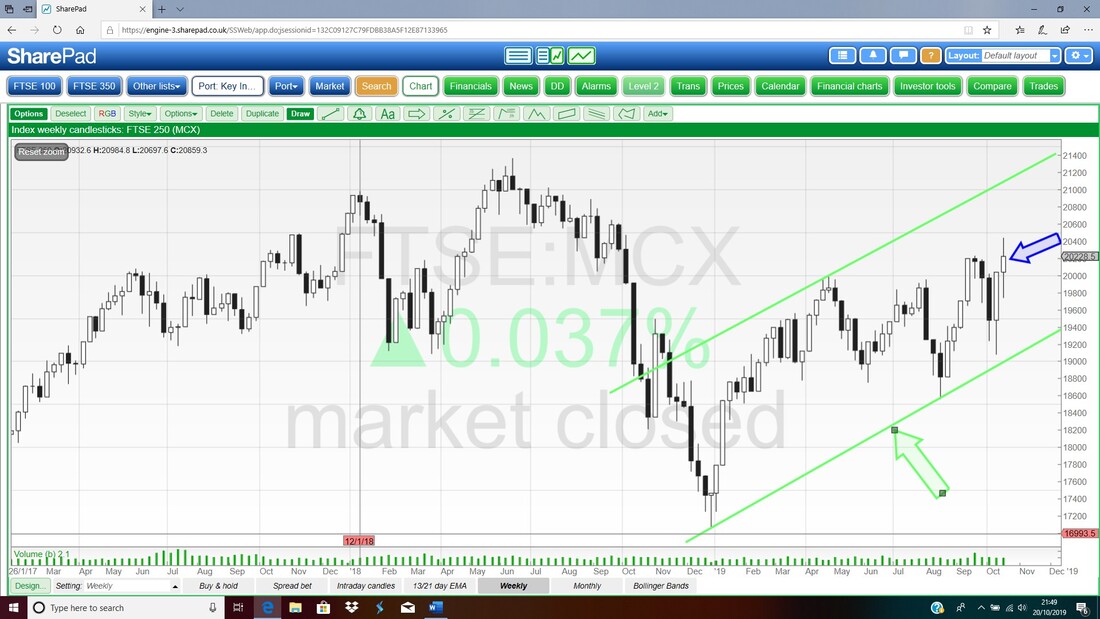
Finally I had to show my favourite Technical Analysis thing which is those 13/21 Day EMAs. On my Chart below for the FTSE250 we have the Daily Candles and my Red Arrow is pointing to a Bull Cross on the 13/21 Day EMAs and this suggests more gains ahead. My Black Ellipse is trying to capture a Small Body Doji from Friday and on Thursday there was a Long Tails Doji both of which show a lot of chopping about. This is no surprise with the Brexit Deal in full negotiation and with a bit more clarity in the coming week very likely, I suspect we will see more gains here. If we do get a pullback, I doubt it is much to worry about.
OK, that is it for this Blog, good luck for the coming week, Cheers, WD. 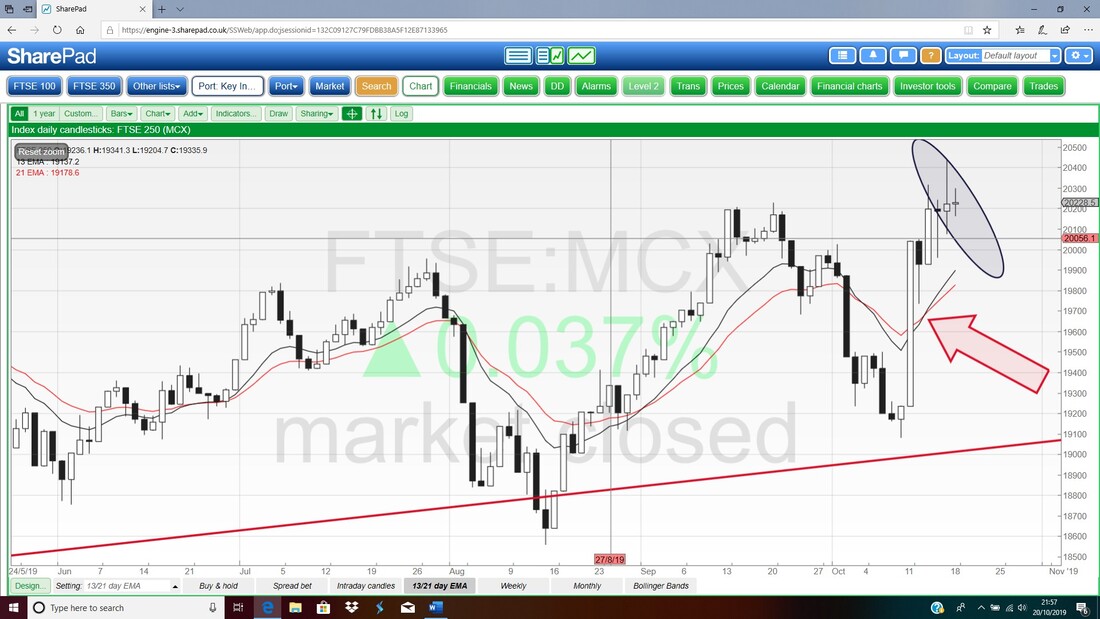
0 Comments
Leave a Reply. |

Stocks & Markets WheelieBlogsThese tend to be more Markets and Stocks related and timely - the Blog Page on the Main WheelieDealer Website has the 'Educational' stuff (well that's the theory anyway !!). Archives
October 2021
Categories
All
|
