

|
stocks & Markets blog |
|
A really strong gain for my Portfolio last week with it up 1.6% and taking it up to the joint highest level for 2019 so far almost to the precise pound. It’s of course quite a strange situation where my probably a bit too big Index Shorts that I am using to Hedge my Portfolio have really helped in the recent drops, and at the same time my Stocks have not been too battered so overall it is helping me make progress.
It has of course been quite difficult mentally to see everyone on Twitter etc. making such strong gains whilst the Markets rebounded from the 2018 damage and my Portfolio was being dragged back by the Shorts. However it just goes to show that when you have a time-proven Strategy that you know will work (you are just not sure precisely when), you need to stay calm and stick with the plan and don’t get distracted by fears and noise and all the countless demons that play with our emotions.
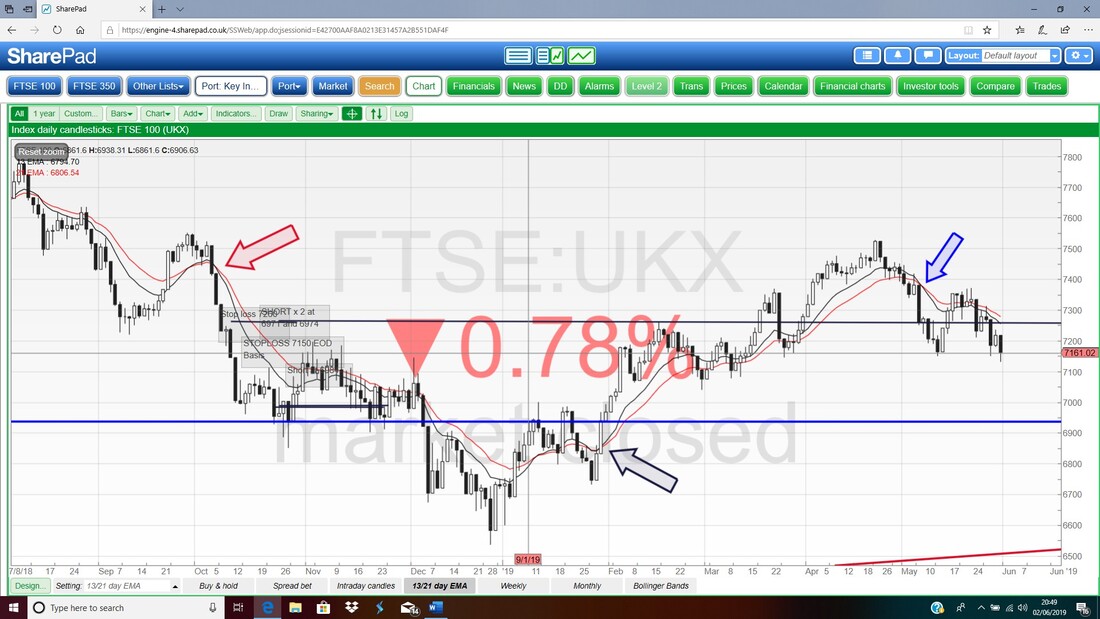
I am not seeing my use of Hedging in any way as a mistake and I am 100% sure it is the best way to reduce Market Risk on a Portfolio without having to destroy the make-up of the Portfolio by needing to sell off Great Stocks or parts of them. Hedging has been absolutely the right Strategy to manage the immense Risks around Brexit and if anything much of the difficulty has been caused by my having Hedges that are probably too big and in future I must remember to make them a bit smaller. Fortunately, on the way up the Shorts have hurt me a lot but now on the way back down they are delivering the goods because they are so big.
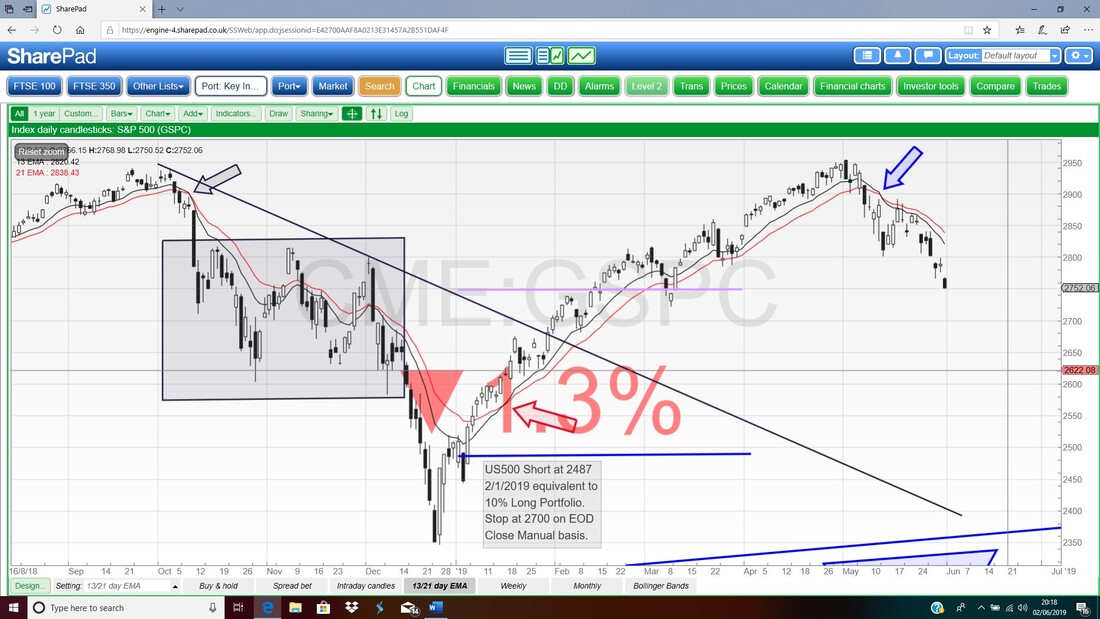
Of course the extent of the Bounce and the duration of it has been a nuisance for me because I am running up Interest Charges etc. However, it is what it is and I would like to get the Shorts closed if the opportunity arises and I am happy to accept some Loss on them to get me out of an awkward situation. In terms of how the Market has behaved, the Recovery has been far more pronounced (a proper ‘V’ shape) than I had expected and in the US we even saw the Indexes get above their All Time Highs for a fraction of a second but soon they started tanking again. This bounce has made things quite painful for me with the damage my Shorts were doing but I definitely have done the right thing to grit my teeth and just manage the problem whilst I waited for things to go my way. In an Ideal World I would have added to my Shorts when things started to go a bit smelly a couple of Weeks ago (probably the best signal was when the 13/21 Day EMAs all did Bear Crosses) but when I weighed things up and thought about it, I decided that my Shorts were far too big already and even if I had Shorted a bit more with a Disciplined Stoploss, it would still be adding to a Risk which had already caused me a lot of pain in 2019 anyway. Had my existing Short Positions been a lot smaller I might have been happier to add to them. Time of Year is always a factor in when the Market makes big plunges and it is not unusual for May and June to be tough Months but they never seem quite as bad as the drops we get in the Autumn and perhaps if we were at that part of the Year I would be happier to add to the Shorts as I could be more sure the Markets were going to drop heavily. As usual on these Weekend Blogs I will look at the FTSE100 and S&P500 Charts further down but off the top of my head I get the sense that we might see more falls in the near term and perhaps we will then form a Sideways Range that could run for a long time – in the past I remember Ranges in the Indexes going on for 3 years !!! We can’t be sure of anything but I really get the sense that those All Time Highs on the US Indexes will form a very solid Top for quite some time. There seems to be immense uncertainty around and the Nasdaq in particular looks crazy overvalued. On the FTSE100 we did not manage to get up to the previous ATHs and it could be that things are looking a lot worse for this Index. Of course much of this is guesswork and hunches but I will try and comment on the size of any Range when I get onto the Charts. The Month of June is historically a pretty nasty one and has the dubious honour of being the Second Worst of the Year and it is only ‘beaten’ in its crapness by September. Typically June starts well and then drops away for the final 3 Weeks – we might see that this Year as Markets do look quite beat up and a bounce would not be a shock for a few days before we then get more falls. The Political backdrop is a total shambles with the UK in a historic meltdown and Trump just doing everything crazy that he can conjure up. He is in the UK this Week so lord only knows what havoc he will wreck but at least there could be many many hilarious moments, especially when he comments on the likes of Corbyn and all the other Virtue Signalers not attending the Royal Feast in his honour. On Friday it is the US Non-Farm Payroll Numbers (the ‘Napalm’) and the usual benchmark of expectations is around 200k Jobs created. The Numbers come out at 1.30pm UK Time and can cause some drama on Friday afternoon. On the Global Economy I get the sense that things are slowly picking up after that short Slowdown we had in recent Months but it still seems like things are very fragile. One surprising thing I noticed was talk of the US LOWERING Interest Rates and that this might happen twice over the coming Year – this is a change of direction and implies that the US Economy is expected to weaken and that Inflation is well under control (‘under control’ is probably the wrong choice of words because it is more likely to be a complete accident that Inflation is low !!). Another significant thing could be that Mario Draghi is leaving the ECB I understand – I have no idea who will be coming in to replace him (I think this is something the Heads of Governments and the new EU Parliament sort out) but it could mean quite a change in Monetary Policy in future and this would especially be the case if a German is chosen as this could mean much tighter Policy. The UK Economy seems to be doing better than it really should be when you consider all the turmoil but with a ‘No Deal’ Brexit looking more likely now than it did a few Weeks ago, it would be no shock if Consumer and Businesses took fright over the Summer and we see the Economy slow down again. Obviously in light of what I have just scribbled my Strategy of pretty much doing nothing will be continuing. I am watching the Markets closely in terms of the Charts and when I get a sense things are near the floor, I will probably start to reduce the size of my Shorts – I would love to at least make these a lot smaller over June and I might remove them entirely if we drop low enough as I can easily whack some Hedges back on fast if I feel a need to. With so much potential for trouble ahead I see no great need to buy any Stocks at the moment. I am mindful that I need something for my Income Portfolio and have a few ideas but I am not rushing to do anything. Hopefully we will have a very pleasant Summer and I can get out and enjoy it. Gaydon Museum Meet-up You can find out details about this one on the ‘Events’ page and the crux of it is that I will be at the National Heritage Motor Museum at Gaydon just off one or other motorway (it’s a bit below Birmingham I think) on Friday 12th July. Again everyone is invited and you just need to pay the entry fee to the Museum but it is well worth going and we should have a good laugh. Come and join us. I am not too worried about knowing who is coming because it is a huge venue and a public place anyway. Generally these kinds of Meet-ups tend to be smaller with perhaps around a dozen people or so which means that if you are new to investing or anything then they can be a superb opportunity to meet up with the highly experienced and successful Investors who I know are coming along. It is well worth taking advantage of. WheelieBash 2019 You can find out more details about this on the ‘Events’ page which is on WD2 (there is a Button at the top of the main Homepage on the main Website and you are actually reading this Blog on WD2 even if you hadn’t realized so if you go to the top of the Page you should find the Menu to get you to the ‘Events’ page) and it is taking place on Saturday 7th September and I can confirm that it will be held at the same venue as last year - the White Hart in Winkfield which is just outside Windsor. There is a link on the Events page to the Pub and everyone is invited but please contact me somehow if you are coming because I need to keep track of the numbers - we are allowed 60 People and it is pretty likely we will get that I think - the List is filling up fast with 20 confirmed attendees already and a lot of people at Mello said they are interested and will let me know (and that was not prompted by me). Blog Slate A few Days ago I published the Blog about how I am tweaking my Approach to put more focus on Quality and to lower Activity and to ensure a more relaxing life. Less experienced Readers might find the copious amounts of Links I put at the bottom of it in the ‘Related Blogs’ section very useful and with the current Market wobbliness it is probably a great time to be reading stuff like this and ignoring what the Markets are doing. I have a few decent Drafts knocked up on several topics so I am sure something will appear as an ‘Educational Blog’ later this coming Week although I have a lot on and I want to start on a Stock Blog because I have not done one for ages and there is a Company that I am very interested in although I might not buy into them yet. I was thinking it would be well worth producing a Blog because it will structure some Research and help me clarify my thinking. If I find time to crack on with that then I might be able to issue a Part 1 later this Week but it depends on time. I have to go to Stoke Mandeville Hospital tomorrow for my ‘MOT’ so that is most of a day gone. Hopefully my health is good but being paraplegic I always have various annoying niggles so it wouldn’t be a huge shock if they find something but fingers crossed I am tickety-boo (whatever that is). With May now out of the way I need to update the ‘Weekly Performance’ page but I might delay that until I have produced the Stock Blog as I want to give that priority. In addition I recorded another TPI Podcast with @Conkers3 a few Days ago and barring any technical issues (of which there may be many !!) that should appear soon – keep your eyes and ears peeled because if we can get it out I think it is quite a good one and has loads of Stocks in it. I just wish there was more time to do all the things I would like to do but sadly life is not like that. I also have some ‘Non-Finance Book’ Reviews to issue but those can wait until I get some time. Some Sights from History Quite a while ago now I had the great fortune of being interviewed by Financial Spread-Betting.com for their Website and they produced some superb short YouTube Videos which I recommend you watch if you have not seen them. If you go to my ‘Podcasts/Videos’ page you can find links but the link below takes you to the first one I think and when you click this it takes you to the YouTube page and you should see other ones selected for you: https://www.youtube.com/watch?v=GvVCPm_1pxM I mentioned a while ago that I might strip the Videos out from the Podcasts and give them their own Page but as yet I have not figured that out or got around to doing it. And with the Markets a bit moody and likely to be so in June as well, here is the classic ‘Bear Markets’ Blog in case you have not seen it or want a refresher: http://wheeliedealer.weebly.com/educational-blogs/taming-the-bear-how-i-handle-nasty-markets It’s incredible to think I wrote that back in March 2015 !!! OK, let’s check them Charts……… S&P500 As usual, the Charts I show are taken from the superb SharePad software that I subscribe to and if you click on them they should get bigger so you can see more detail. First off I just want to throw this Chart in quickly because when looking at Charts we must always keep the ‘Big Picture’ in mind and my Chart shows the Uptrend Support Line in Blue with the Blue Arrow and this is still very much in force and as long as we stay above about 2250 ish then the Bull Market is still on. If that Blue Line fails, then that is the time to get really worried. 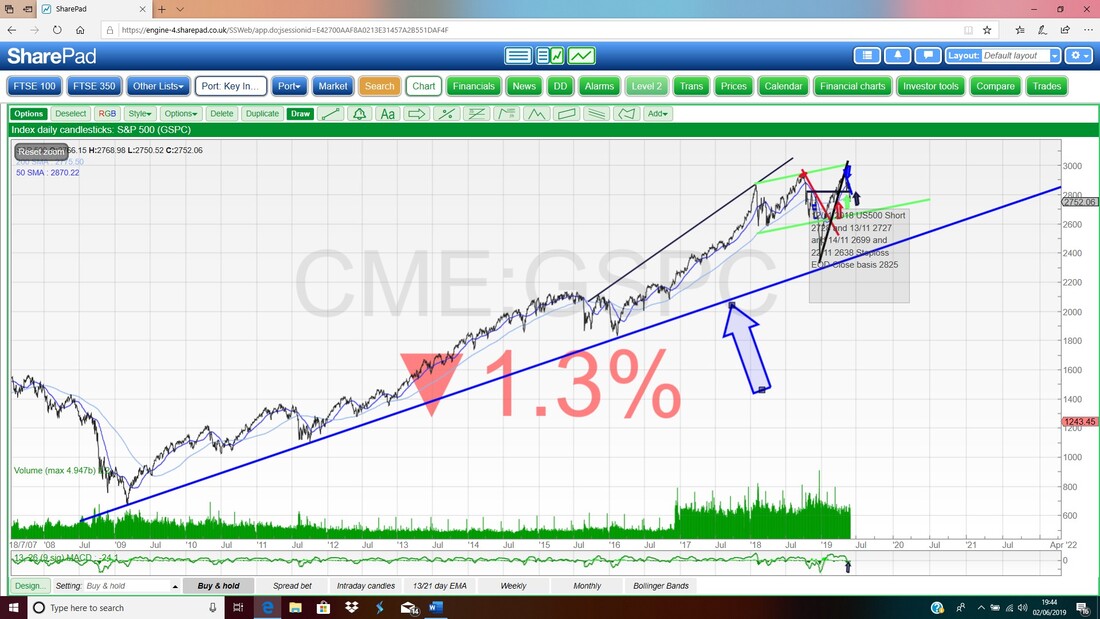
On the next Chart I have zoomed in hugely and first off I want to point out on the Left Hand Corner where my Red Ellipse is and then look to the Right Hand Corner where my Big Black Arrow is. These point out the All Time Highs and they are at extremely close levels which suggests that this might be a Bearish ‘Double Top’ and if so that would mean trouble ahead (note, I don’t mean immediate trouble as that is probably a given but I think it would imply months of falls ahead).
Next look at my Blue Resistance Line marked by my Blue Arrow and if the Bulls are to take control of the S&P500 again then they need to drive the Price through this Line. This Blue Line is marking the Downtrend that is playing out at the moment. Next my Red Arrow is pointing to a Black Down Candlestick that was created on Friday and this on its own is Bearish. Note it settled at 2750 and this could be a decent Support Level from which the Price moves up early in the coming Week – however, if we do bounce it might not have any legs and just be a precursor to more falls. One of the best signs for this is the 13/21 Day EMAs and we will come onto this in a bit. Looking at the left of the Chart it looks to me like there is good Support at about 2600 and just below but if things get really bad then there is strong Support at 2350. In terms of a possible Range that I was talking about earlier, I would suggest perhaps 2600 to 2950 or if 2600 fails then perhaps ti could be wider at 2350 to 2950. However, if there really is a ‘Double Top’ (Bearish) then maybe a Range would be something like 2350 to 2700/2800. 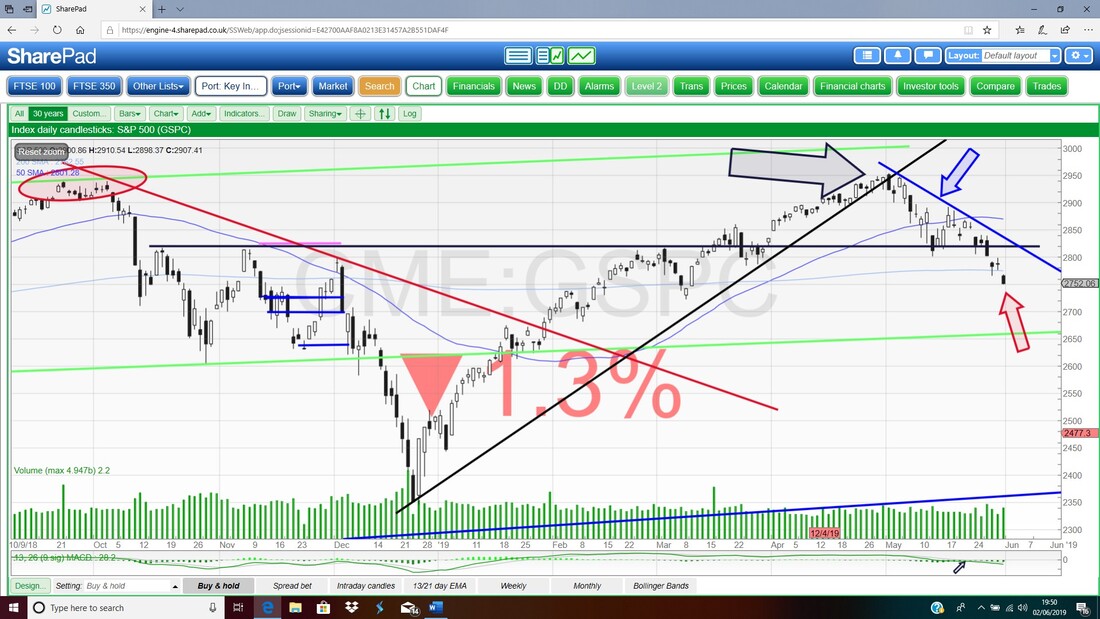
In the bottom window on the Screen below we have the RSI (Relative Strength Index) for the S&P500 Daily. On a reading of RSI 34 where my Arrow is, this is very low but not extreme and in the short term we could fall a bit more. However, this is also a level which could be bounced from but I suspect any bounce would be short lived.
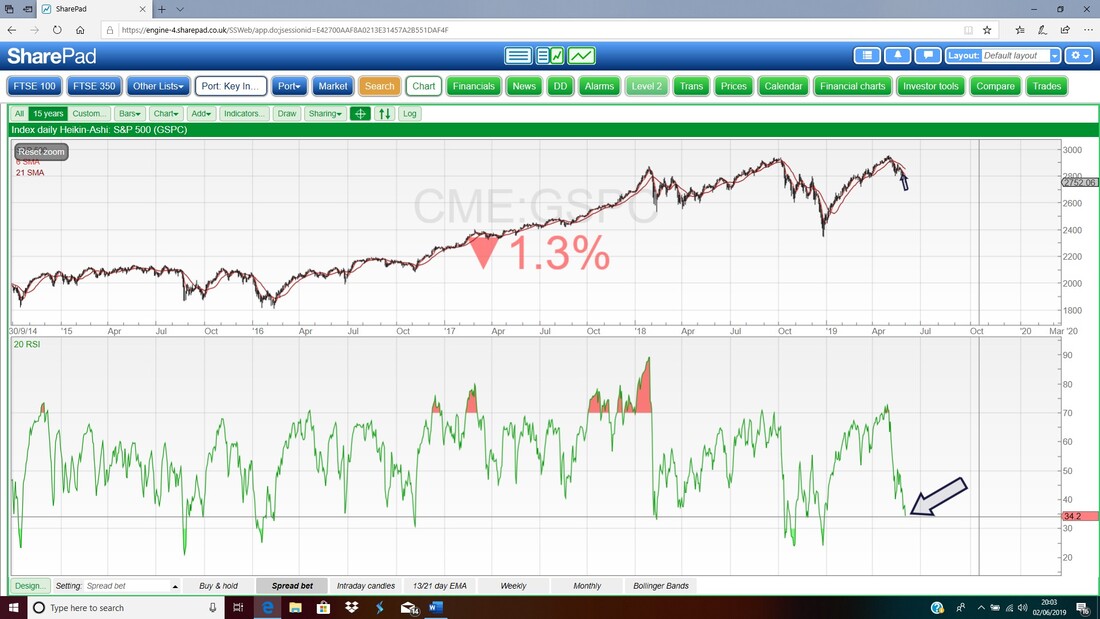
The next Chart has the Daily Heiken Ashi Candlesticks. Remember these form up based on an average over 2 Days and therefore they are totally different to the usual Japanese Candlesticks and use a much more simple means of interpretation. Where my Blue Arrow is we have the HA Candle for Friday and this is Big and Black which is Bearish and thus implying more falls.
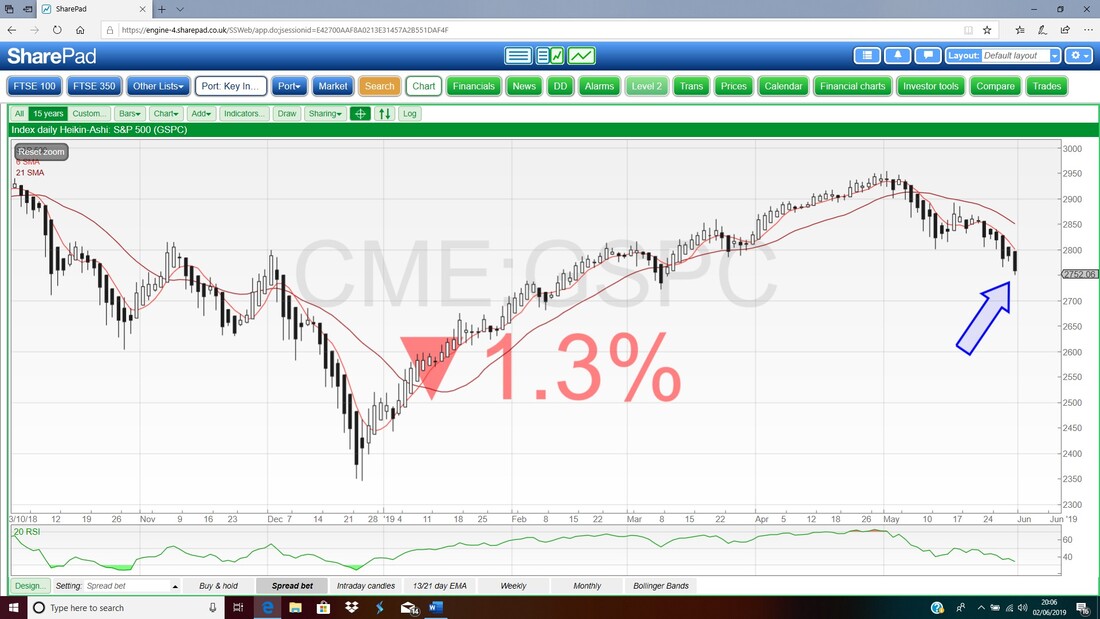
Next we have the Daily Candles for the S&P500 but with the 13 and 21 Day EMA Lines (Exponential Moving Averages – calculated similar to a normal MA but with more weighting given to more recent Values). My Blue Arrow marks where we had a Bearish Crossover and this is still ‘in force’ and until we get the reverse like where my Red Arrow is, this implies more falls. What a superb Signaler this is.
Next it’s the Weekly Candles. My Black Arrow is pointing out a Big Black Down Candle from Last Week and this is Bearish and implies more falls.
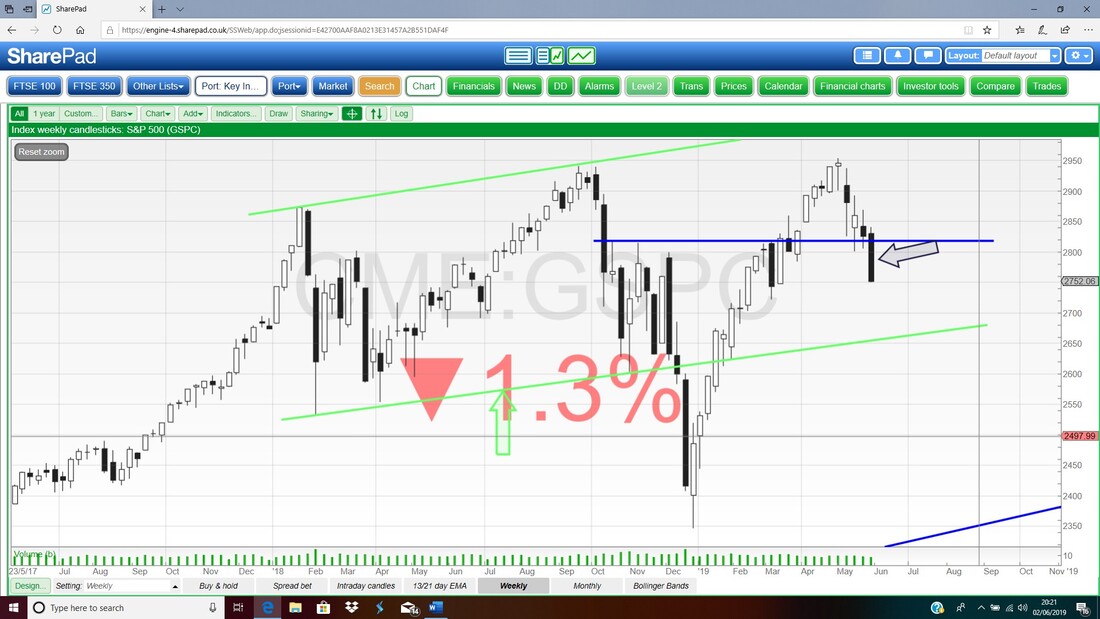
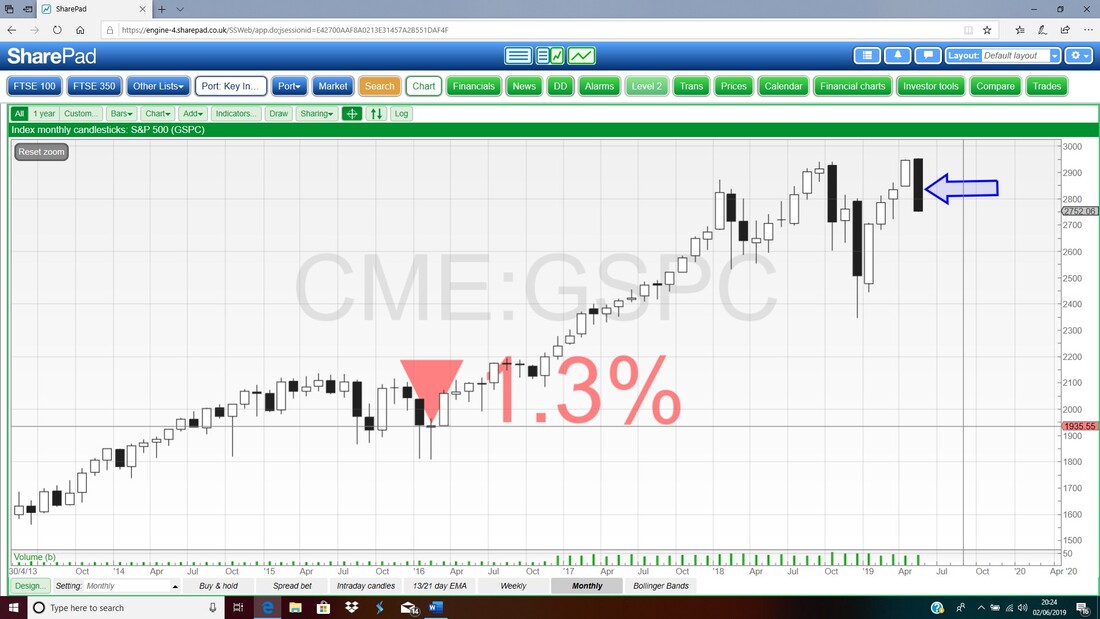
We have now completed the month of May so the Candle that has formed up is valid and my Blue Arrow is pointing to it on the next Chart and this is Big and Black and very ugly.
FTSE100
Again I am starting with the Big Picture. My Chart below shows the Uptrend Channel from 2009 is still valid and the Bull Market is still full on until that Red Line at the bottom which is Support (where my Red Arrow is) is broken down through. At the moment the Price Action is all within the Uptrend Channel. 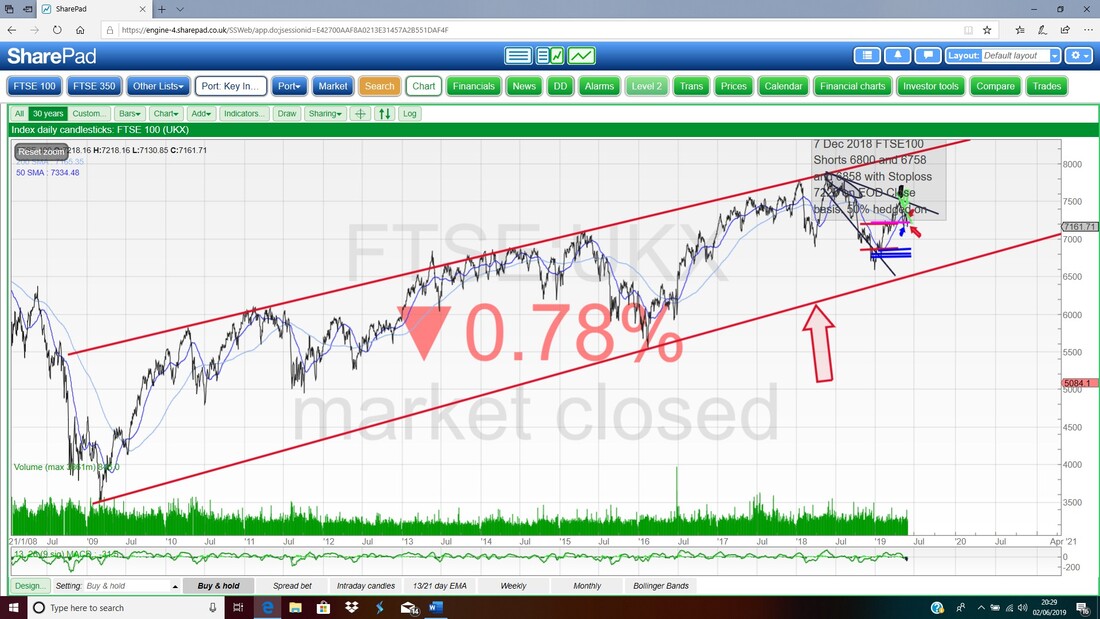
On the next Chart of the FTSE100 Daily Candles, first off look at the Top Left-Hand Corner where my Black Ellipse is loosely pointing out the All Time High which was up at 7903. Next look at my Black Arrow which shows the recent Peak at 7530 – this is what I mentioned earlier where unlike on the US Indexes we never managed to get back up to the previous All Time High on the FTSE100 and this shows weakness.
Next the Green Line marked by my Green Arrow is now the Downtrend Resistance Line and Bulls must get the FTSE100 back through this for things to properly improve. My Red Arrow is pointing at the Down Candle from Friday but note it did Close a bit up off the Low Point of the Day at 7130 which is now nearby Support. Note how we dropped below the Support at 7150 from where my Blue Arrow is and this is a sign of weakness. In terms of my Sideways Range theory, for the FTSE100 it might be something like 6900 to 7500 or perhaps if things get weaker the Range could be 6500 to 7200 – but at the moment I am just guessing at possible scenarios. Note down below we should have Support at 7000 and then 6900 but if this fails then we could go down to 6700 and nearer to 6500. The latter is really important and I would say it is vital we stay above 6536 because this was the December 2018 Low point. 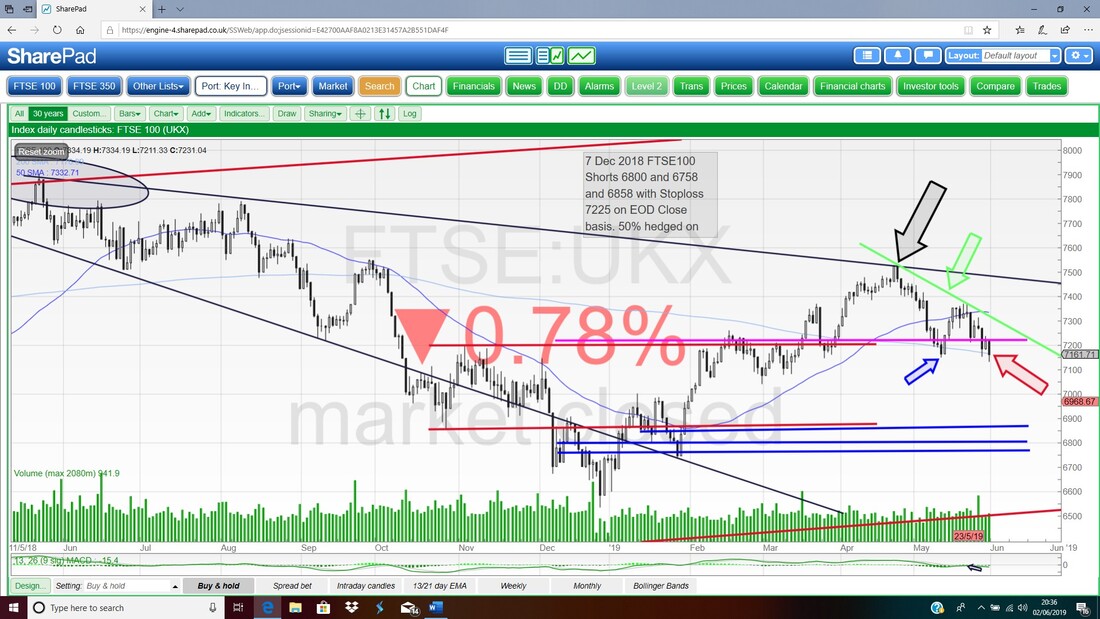
In the bottom window next up we have the RSI for the FTSE100 Daily. On a reading of RSI 39 this is quite low but can go a lot lower.
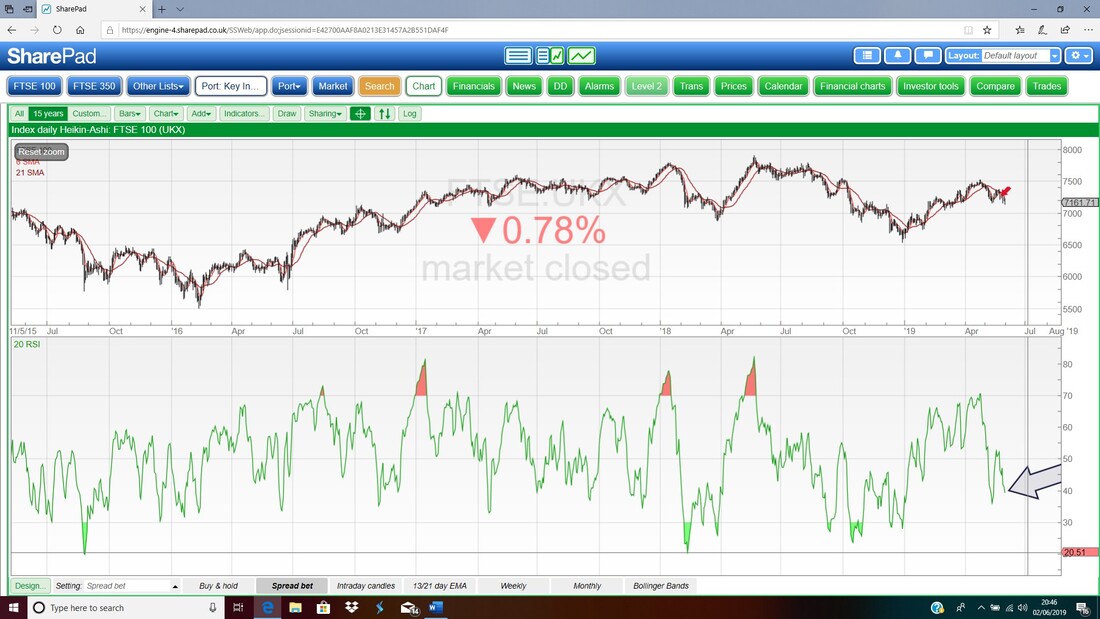
Next we have the Daily Heiken Ashi Candles for the FTSE100. My Red Arrow is pointing to a Big Black Down HA Candle for Friday and this is Bearish.
Next my Blue Arrow is pointing to a Bearish Cross on the 13/21 Day EMA Lines and this is implying more falls whilst it is ‘in force’.
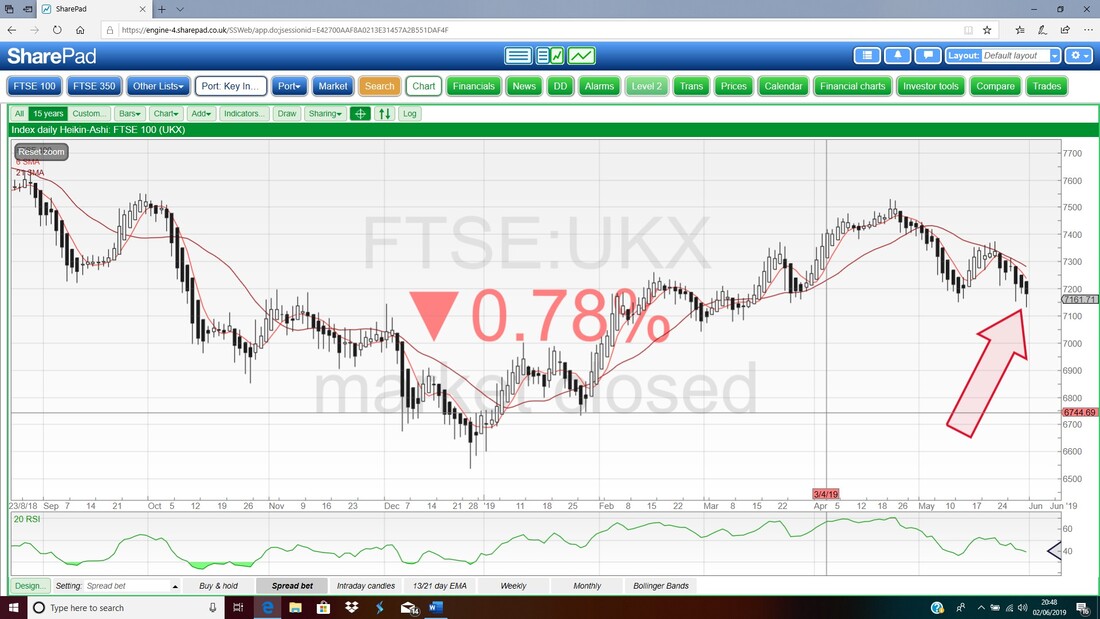
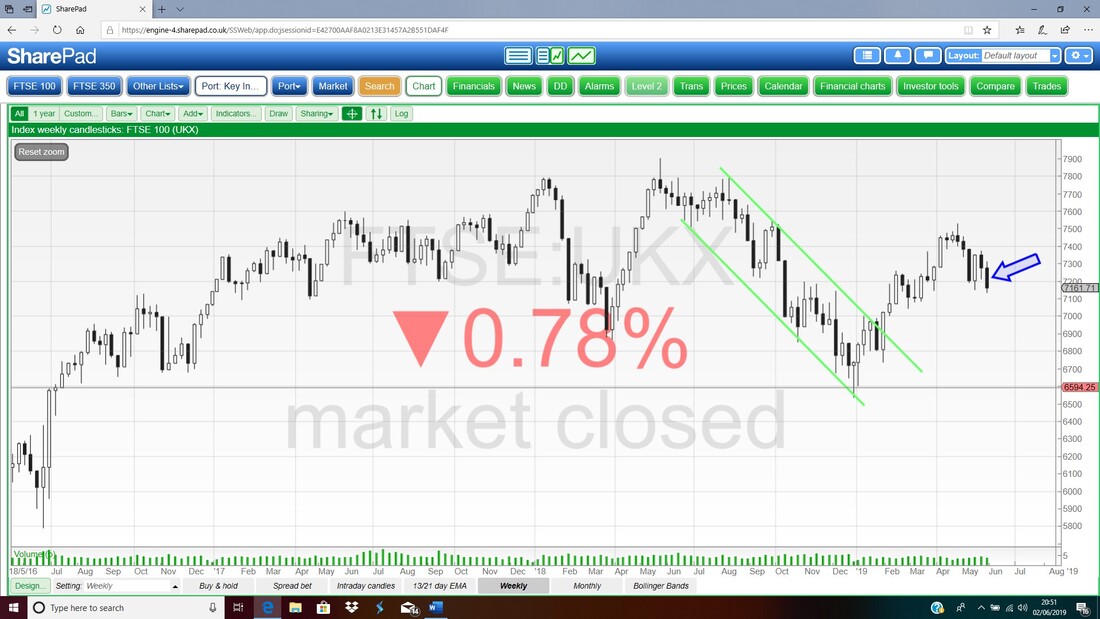
Next Chart is the Weekly Candles for the FTSE100. My Blue Arrow is showing a Big Black Down Candle and this looks Bearish.
Finally we have the Monthly Candles for the FTSE100 now May is complete. My Blue Arrow is marking a Big Black Down Candle – it looks Bearish and suggests more falls.
OK, that’s it for this Blog, Good Luck for the coming week and don’t do anything rash or panicky !! Cheers, WD. 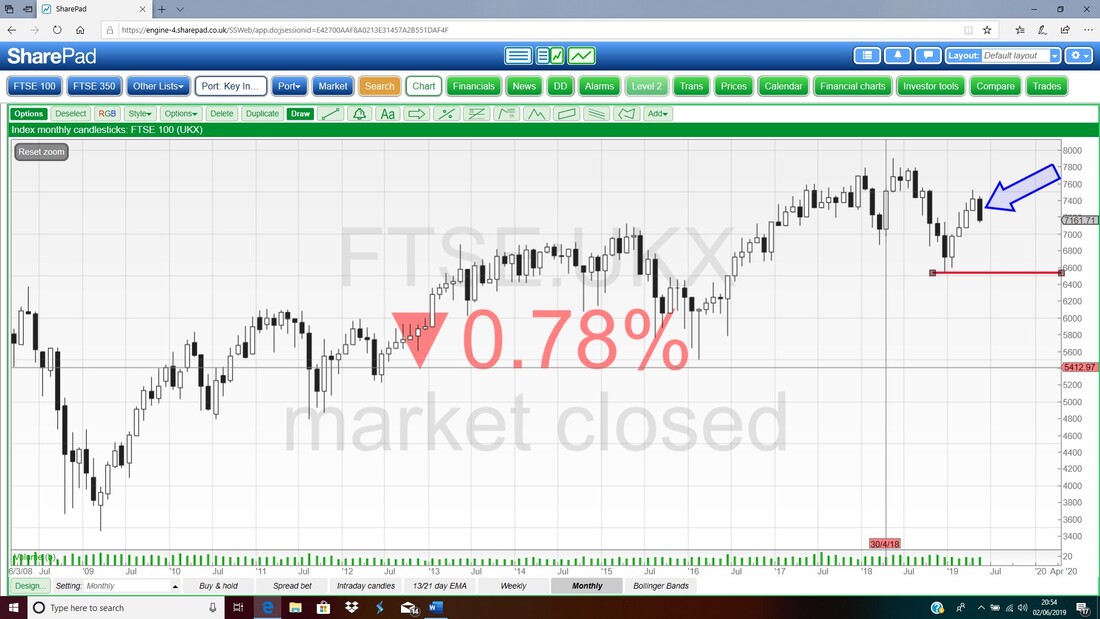
0 Comments
Leave a Reply. |

Stocks & Markets WheelieBlogsThese tend to be more Markets and Stocks related and timely - the Blog Page on the Main WheelieDealer Website has the 'Educational' stuff (well that's the theory anyway !!). Archives
October 2021
Categories
All
|
