

|
stocks & Markets blog |
|
Rather historic events 50 years ago but I can’t help thinking that Politics in the UK and also the Markets are unlikely to be a ‘Sea of tranquility’ in coming months. I will get onto the Index Charts later in this Blog, but they are particularly noteworthy because the US Indexes had a big down day on Friday and this suggests to me that they are starting to turn down. It might just be a healthy pullback but with all the Economic and Political woes around the Globe it could easily become something larger.
On Tuesday we should get it confirmed that Boris will be the new Prime Minister (I think it is around 11am but I might be wrong) and then on Wednesday Theresa Maybot will do her last PMQs and then she will head off to see the Queen and shortly after this Boris will go and see the Queen and then the ceremonials will be out of the way. There might be some drama on Wednesday morning when Philip Hammond, the Chancellor, is saying he will resign pretty much after PMQs by the looks and several other Cabinet Ministers are likely to resign as well. Needless to say, the need to appoint a new Cabinet will be immediate and we might even get news on this on Wednesday Night.
Lord only knows where Brexit is going to end up and all we can be fairly sure of is that there will be immense turmoil and this is likely to hit an already weak Economy and it will be amazing if we avoid Recession or at least one quarter where UK GDP goes backwards (in the official definition you need 2 Quarters of ‘negative growth’ to have a Recession). This is likely whether or not UK leaves the EU on ‘No Deal’ terms – the uncertainty and pratting about is causing consumers and businesses to keep their wallets firmly closed.
On top of this it strikes me that the only major Economy to be chugging along nicely is that of the US but with Jerome Powell (the new bloke at The Fed) steering towards a couple of Interest Rate Cuts, this does not look like an Economy that is strong and expecting that to continue. As vital as the US is to the global economy it is hard to see how it can keep growing at a decent rate when the rest of the world is slipping into Recession. China and Japan have come out with poor numbers recently and Europe looks particularly troubled – throw in Brexit and things have a lot of potential for grief. And I didn’t even mention Iran. Last Week Rather unusually it seems my Portfolio had a strong Week with a gain of 1%. I think some of this was down to MPAC doing well (strewth, have I mentioned how cheap that is? I seriously think it could hit 600p with patience) and I think the Index Shorts I have on helped a bit. Anyway, this has improved the overall state of my Portfolio and at the time of writing it is down about 1% on the year which I am quite relaxed about as I have huge Hedges in place and much of the drag has come from these. I suspect these Hedges are about to pay off very well……… In terms of my Strategy then nothing has changed. The key focus for me is to get another Short on (probably the FTSE100) and it doesn’t need to be particularly big but the logic is to get my average price up (because I am short it is precisely the opposite of Averaging Down like you would on a Stock where you are Long) and doing this should mean my Shorts get back to breakeven a lot faster and who knows but it might even drop really badly if things all come to pass in a very nasty way (which is entirely possible). However, any new Shorts I add will have strict Stoplosses. In terms of Stocks I am doing nothing. The bias is towards selling any if the need/opportunity arises but with the huge Hedges I have there is no need to sell Stocks to protect my Capital (that is the whole point of the Hedges – they give a similar effect to Selling but without me having to break-up my Portfolio unnecessarily). I cannot imagine myself buying any Stocks unless and until Brexit is out of the way and it seems likely that I will have a very relaxed run in to 2020. WheelieBash 2019 If you go to the ‘Events’ page which sits on WD2 (click the appropriate button at the top of the main homepage or as you will be reading this Blog on WD2, just go to the Top Menu) you should see details of the WheelieBash this year. As in previous years we will be holding it at The White Hart in Winkfield which is a cracking little pub just outside Windsor and near to Legoland (I was there on Friday funnily enough) and it is taking place on Saturday 7th September. It is completely an open invite and there is no entrance fee or anything and it is just a great opportunity to meet up with other Investors and Traders of all ages and skill levels and if you are new to the game then it is definitely something you must attend. Numbers are steadily building up and we are getting near 30 now and we have a maximum of 60. Last year it seemed to be that as we got nearer the time there was a rush of people letting me know they were coming so it might be best to get in early. It is very flexible and I will be there from about 12 Noon and I will probably be there until they close !! Blog Slate I published the short Buy Rationale Blog for LVCG a few days ago and this week I will probably start writing one about getting to the stage where I will start ‘drawing down’ from my Share Portfolios which has several implications and considerations and I will explore these. I have been reading Mark Simpson’s excellent book which is funnily enough about excellence in Investing and if you go to Wheelie’s Bookshop you should see it there at the top if you fancy grabbing a copy. I am making thorough notes as I read it and I expect to mould these into a Blog fairly soon and that is probably a few weeks away. I also intend to write a Stock Buy Checklist for AIM ‘Story Stocks’ which should help Investors separate the very few good ones from the overall preponderance of utter kaka. I then want to start on the ‘Timing the Market’ blogs but looks like there is a lot to do before I get on to those. And there is the ‘Weekly Performance’ page which is going to become a unique ‘double header’ with June and July in it. I also have loads of ‘Non-Finance Books’ to do write-ups on – I published a Blog about a Drunken Bag Lady just the other day………. Something else keeps nagging away at me and I suspect reading Mark’s book is not helping me shake off the itch. It has been in my mind for years that I would like to write a Book but I have been constrained by lack of time, lack of clarity on a subject (many great Investment books have already been written so what is the point?) and the admin hassle involved. Anyway, I have made a bit of a breakthrough because I have figured out that if I do write a Book it should be specifically on the subject of Long-Term Investing but be very much about buying a Portfolio of decent Stocks and totally a Buy & Hold type of thing that people who have full time jobs and families and little time can manage. I am sure that is quite a unique angle (many Books like Naked Trader etc. have quite a Short-Term Trading slant to them and I would like to be more focused on a Long-Term, low stress, low risk, low effort, method) so at least I have that bit sorted out but the time and admin are more added treacle. Oh, and I would scribble it in my normal style so in theory it would be quite down to earth and easy to read and of course the academic BS and equations and stuff would be banished. My thinking is that at some point in time when I get enthusiasm to crack on with a Book (assuming I do, it might not happen), I will have a period of months where I do not produce any ‘Educational’ Blogs during the week but I still do a ‘Weekend Markets Blog’ like what you are reading now and of course you will never get me away from Twitter !! This might take 6 months or something, I have no idea, but that is the only way I can see it happening. It would make sense if I do this as a ‘Winter project’ but I don’t think it will start this Winter because I have loads of blogs ideas that I want to write and I would like to get them done before heading off on a new route. What I might be able to do in parallel this Winter is to at least create some sort of structure with Chapters and stuff but we’ll have to see how it goes. I fancy having a book with my Wheel on it sat in Waterstones…….. Oh, I had a chat with Peter Conkers3 the other day and we are both really busy so the TPI Podcasts are parked at the moment but I am pretty sure we will be starting them in anger again in August. I am pleased to see that people are still finding the Podcasts we have already recorded worth listening to and we have been trying to include a lot of Educational type of material in them. Discovered on the Moon……. First off with things potentially looking ropey as we get towards Autumn, here is the old reliable ‘Bear Market Blog’: http://wheeliedealer.weebly.com/educational-blogs/taming-the-bear-how-i-handle-nasty-markets And this next one seems appropriate in light of the comments I have just made about a possible WheelieBook: http://wheeliedealer.weebly.com/educational-blogs/the-appeal-of-long-term-investing Right, that’s enough gibber-jabber, let’s see how messy these Charts look. S&P500 As always the Charts I show come from SharePad and if you click on the images they should grow bigger so you can see the detail better. The S&P500 broke-out to new All Time Highs recently which is of course very bullish behavior but the action of recent Days suggests to me that it is turning down. This could be just a Pullback but then again all big drops start with just a mere Pullback. My Blue Arrow is pointing at a big Down Candle from Friday. In isolation this might not be all that bearish but note it is a ‘Bearish Engulfing’ Candle because it covers all of the Candle from Thursday but more importantly if you look right at the top where my small Red Arrow is, we had a small ‘Hanging Man’ sort of Candle and as I probably mentioned at the time, this has turned out to be a Turning Point and the move down on Friday simply confirms this. The question now is how far will it drop and the obvious nearby Support is the 50 Day Moving Average area around 2900 (where the wavy Blue Line is). 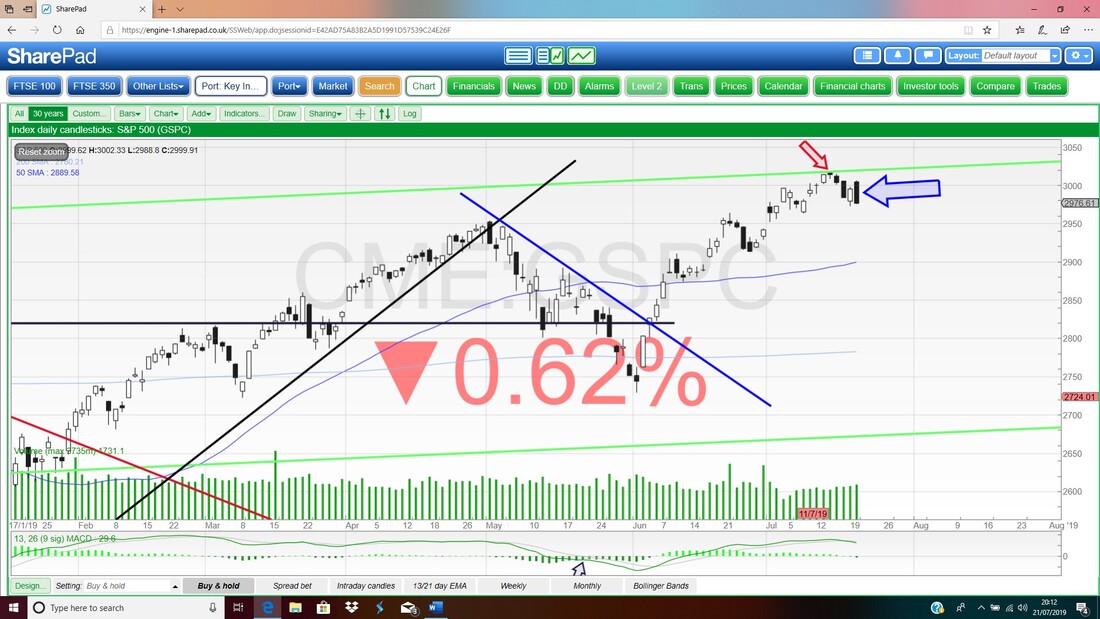
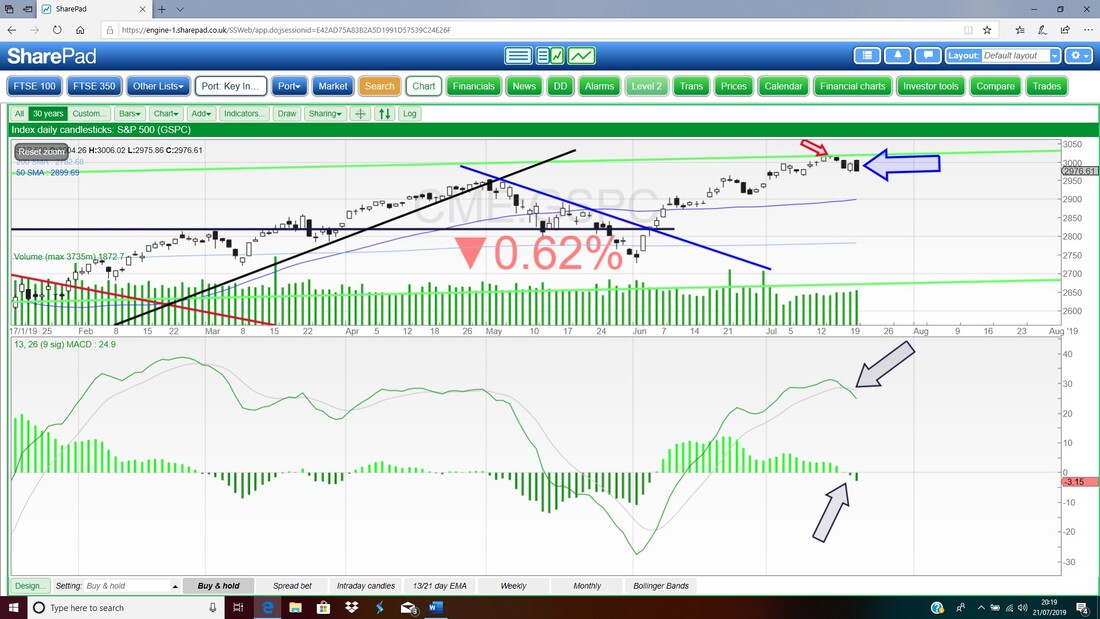
In the bottom window on the next Chart we have the MACD for the S&P500 Daily (Moving Average Convergence Divergence) and where my Black Arrows are they are showing a Bearish MACD Cross in the Histogram Bars format lower down and in the Signal Lines format higher up. This is obviously not great although I find the Daily MACD quite a fast Indicator and prone to false signals or signals that get reversed quickly. On that basis it is probably not a good idea to act on this one Indicator on its own but combined with other Bearish Indicators it doesn’t inspire confidence to be buying.
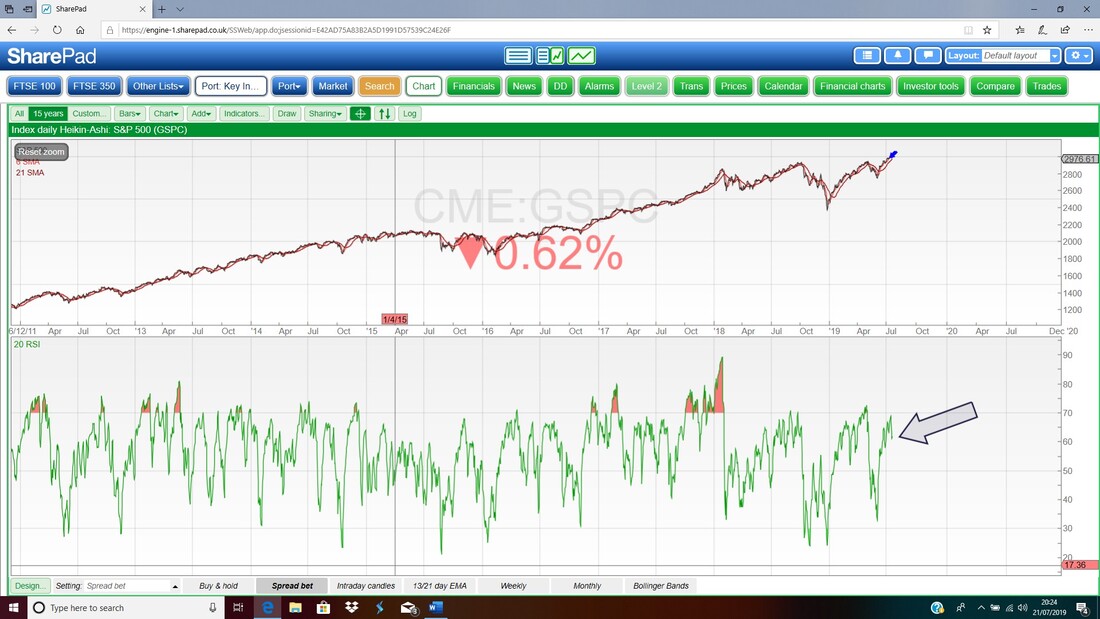
In the bottom window on the image below we have the RSI for the S&P500 Daily (Relative Strength Indicator). Where my Black Arrow is we are still on a Reading of RSI 61 which is quite high and note it is moving downwards. Another Bearish indicator.
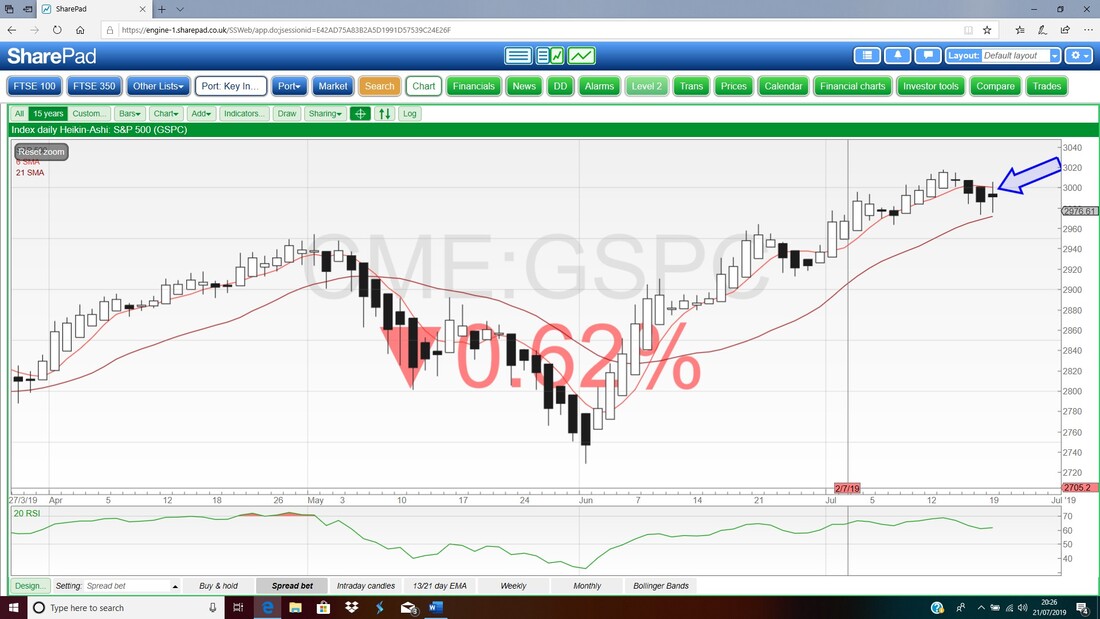
This next Chart is interesting. My Blue Arrow is pointing to a Narrow Candle with Long Tails but note this is a Heiken Ashi Candlestick which is completely different to ‘normal’ Candles. On the face of this Chart it is saying that the move down might be weakening – we had 2 Big Black Down HA Candles and now it has gone narrow. I wonder if this is a false signal or will it be right? My bet would be that it is false – the key thing is that HA Candles are great Indicators because they give very clear signals but they are ‘slow’ (each HA Candle forms up over 2 days) and there are signals in other things like we have already seen which are ‘faster’ and will probably have more sway.
However, with all this very short-term bearish talk, here is a Chart which still favours the Bulls. It is hard to see but the Yellow Arrow right where we are now is showing that the Black Wavy Line which is the 13 Day Exponential Moving Average (EMA) is above the Red Wavy Line which is the 21 Day EMA. If you look back you will see that Bulls need to avoid a Bearish Cross like what we had where my Blue or Black Arrows are. If we get one of these Crosses, it would suggest Weeks of falls ahead. I love this Indicator.
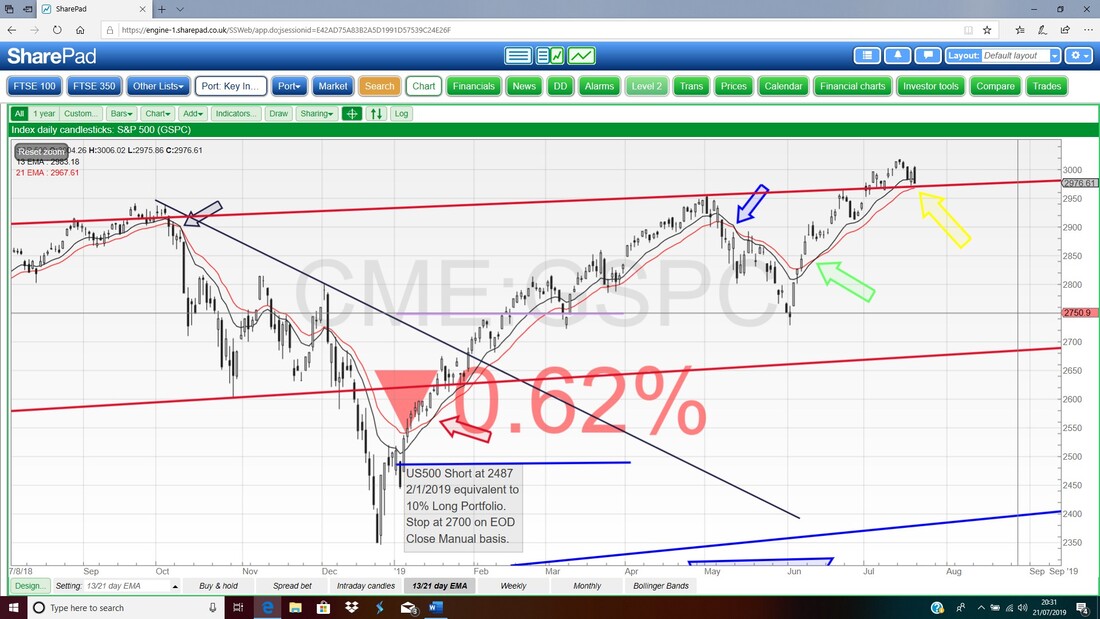
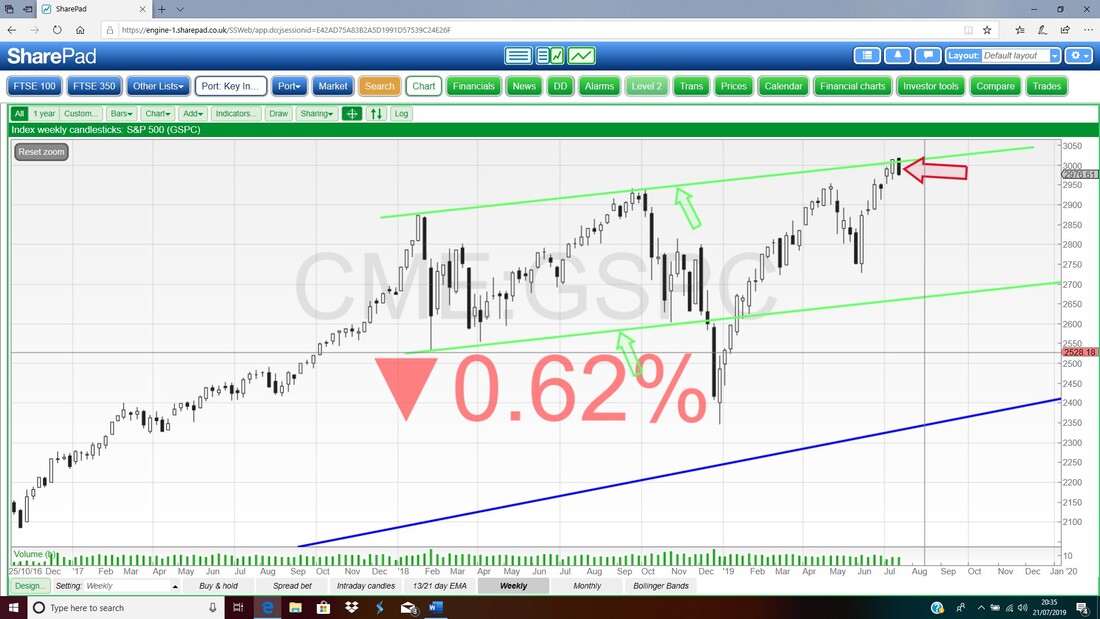
And now back to reality……Here we have the Weekly Candles and my Red Arrow is pointing to a Big Black Down Candle from last week and this is bearish – particularly because there was a nice White Up Candle the week before which was a positive set-up for Bulls to push on from. The fact that they failed to build on a decent set-up is negative. Note also it is up near my Green Topline of the Channel that has been running a while, marked by my Green Arrow.
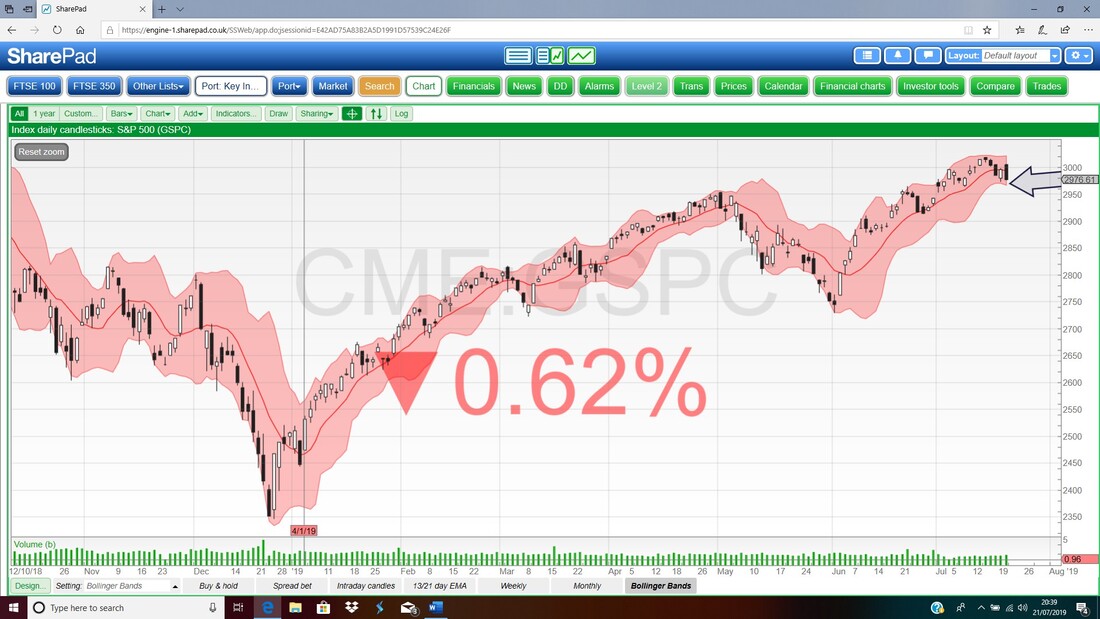
Finally we have the Daily Candles for the S&P500 with the Pink Zone around them marking the Upper and Lower Bollinger Bands. Where my Black Arrow is I am trying to show that the Price Closed on Friday not far from the Bottom Bollinger Band. This Band could act as Support (although I doubt it will !!).
For time reasons I won’t show the DOW and Nasdaq Comp but to be honest there is little point because they are very similar to the S&P500. Only difference of note is that on the DOW Weekly you could have a combined 2 Week Candle Pattern which is a Bearish Harami.
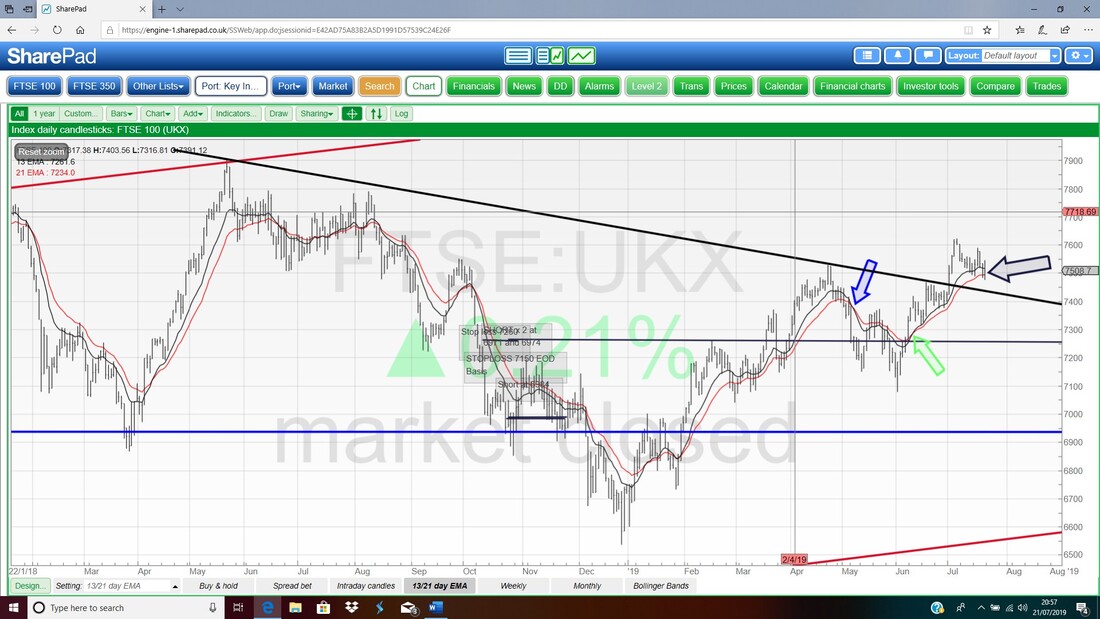
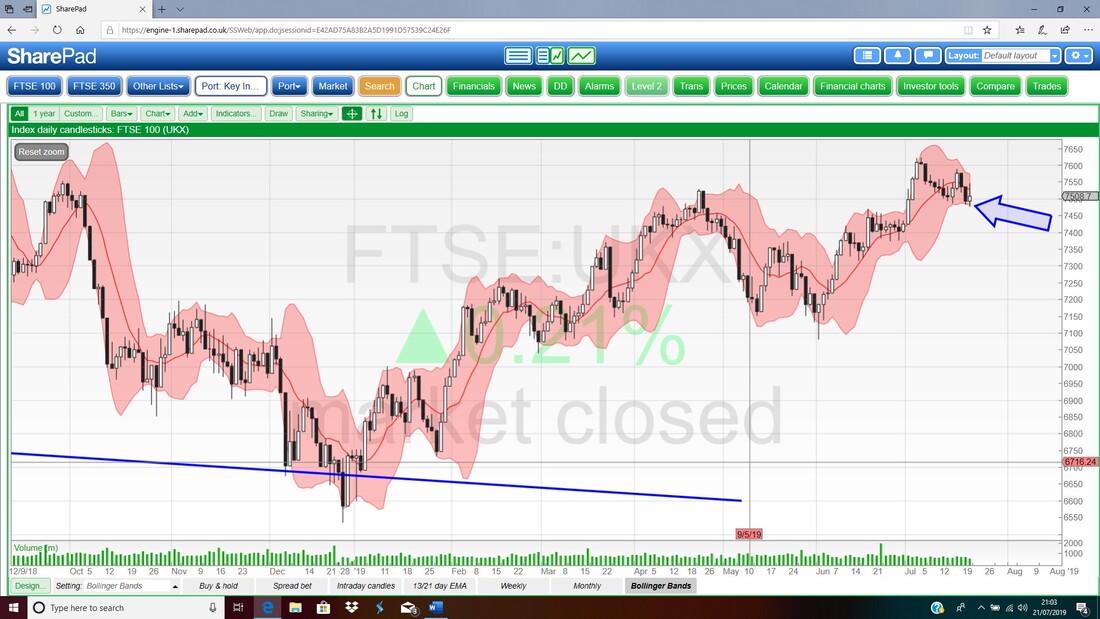
FTSE100 First off we have the Daily Candlesticks and where my Red Arrow is I am pointing to an Up Candle from Friday and note it was unable to hold the High of the Day. However, that in itself is not necessarily all that bad and in combination with the Candle from Thursday, this could be a Bullish 2 Day Harami Pattern – BUT, the context is all wrong and it would need more of a drop beforehand for a Bullish Harami to be valid. Look next at my Black Arrow which is pointing to the recent Peak with a Gravestone Doji sort of Candle from which the FTSE100 fell for about 6 Days and then it turned up again to where my Blue Arrow is but note how it then dropped again. The important thing here is that the FTSE100 made a High where my Black Arrow is but then made a ‘Lower High’ where my Blue Arrow is – this could be a Downtrend Move starting. 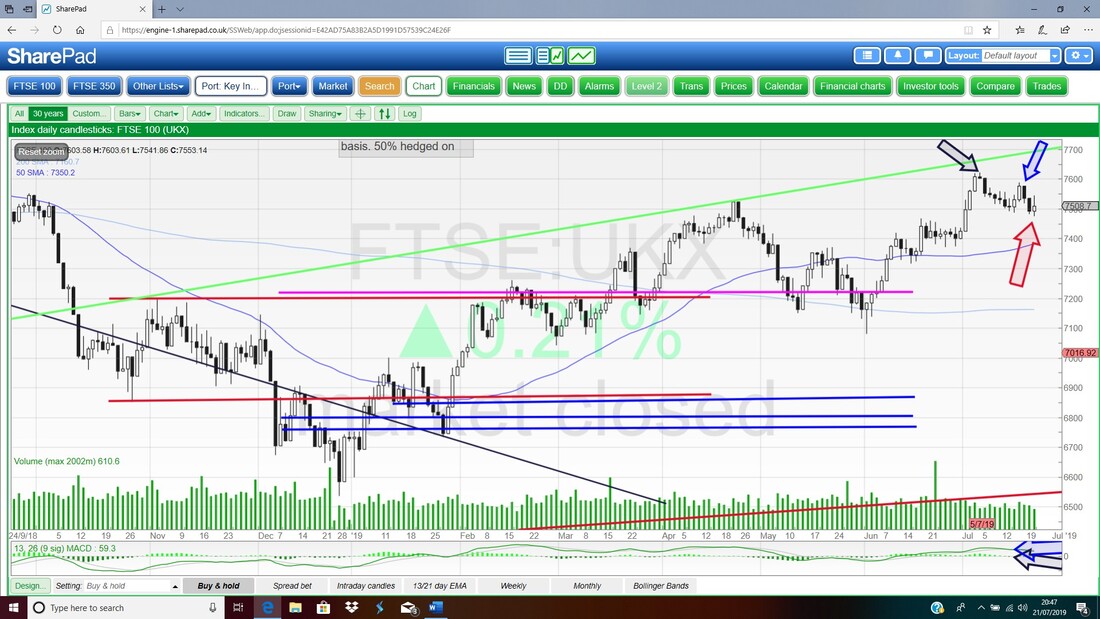
In the bottom window on the next image we have the RSI for the FTSE100 Daily. On a Reading of RSI 57 where my Black Arrow is that is not all that high but note the direction is down.
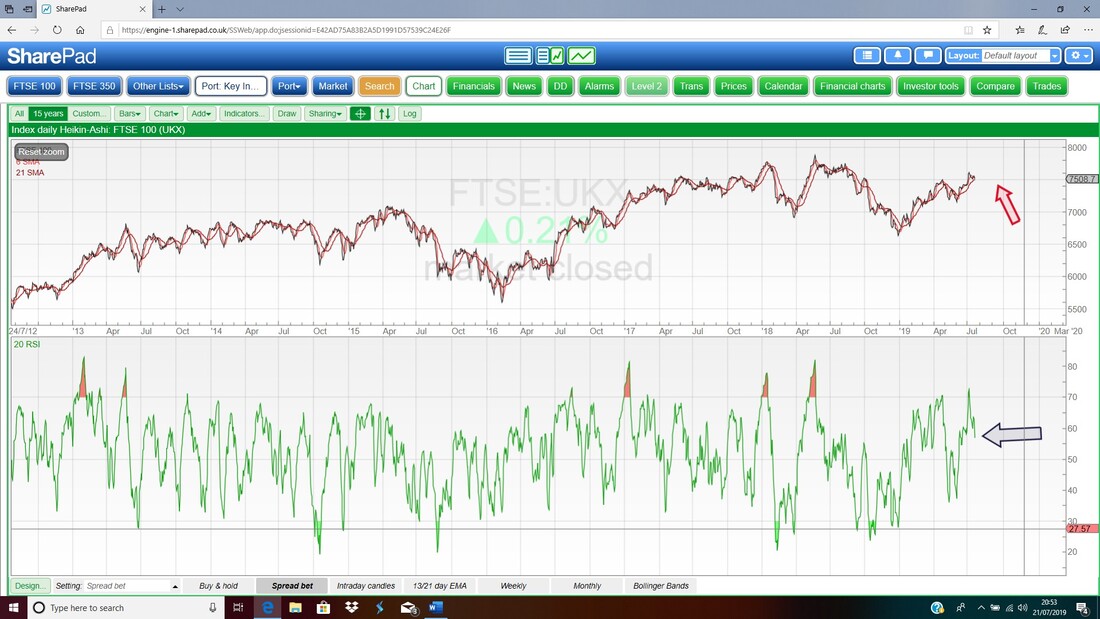
Next it’s the Daily Heiken Ashi Candles for the FTSE100. Where my Arrow is we have Big Black Down HA Candles – that’s bearish.
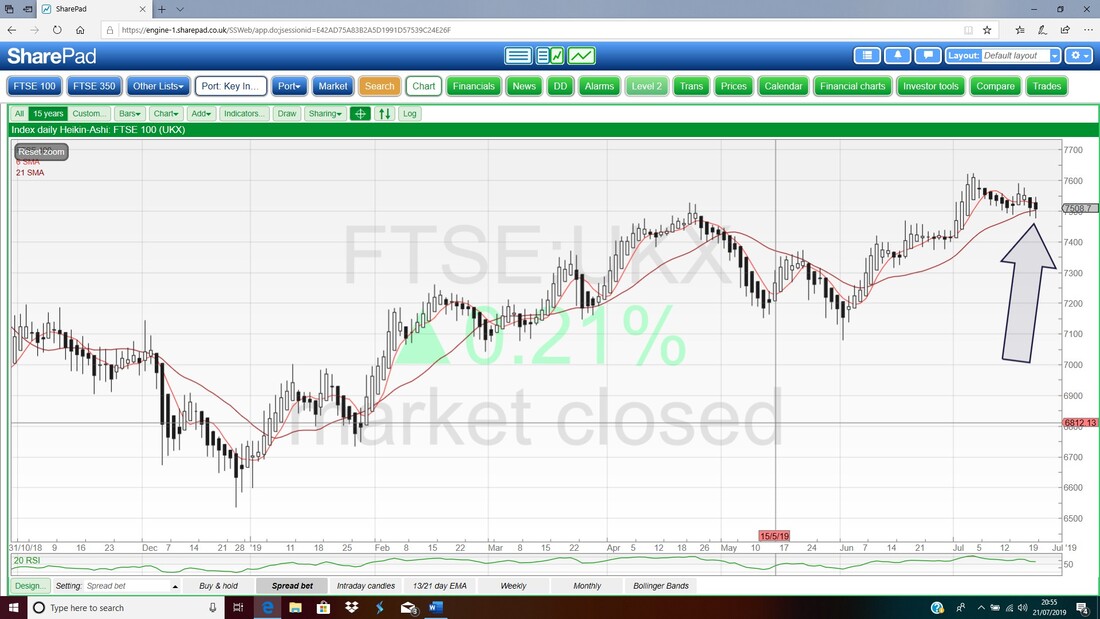
The Chart below is really about my favourite Indicator of the 13/21 Day EMA Crosses. Where the Black Arrow is now we are still in Bull Mode after the Bullish Crossover back where the Green Arrow is. Note this is not inconsistent with the other more Bearish signs – this is a slow Indicator but highly reliable and we can get falls in the very short term which still keep things Bullish on this Chart.
Now we have Weekly Candles for the FTSE100. My Blue Arrow is pointing to a Doji Candle but note that it fell from the High of the Week which isn’t great. Of course such a Candle is a bit better than if we had had a Big Down Candle but it merely shows Bulls and Bears were fighting hard and neither really had the upper hand.
I mentioned in my Blog last Week about how the High of 3 Weeks ago where my Red Arrow is could be the Turning Point down. 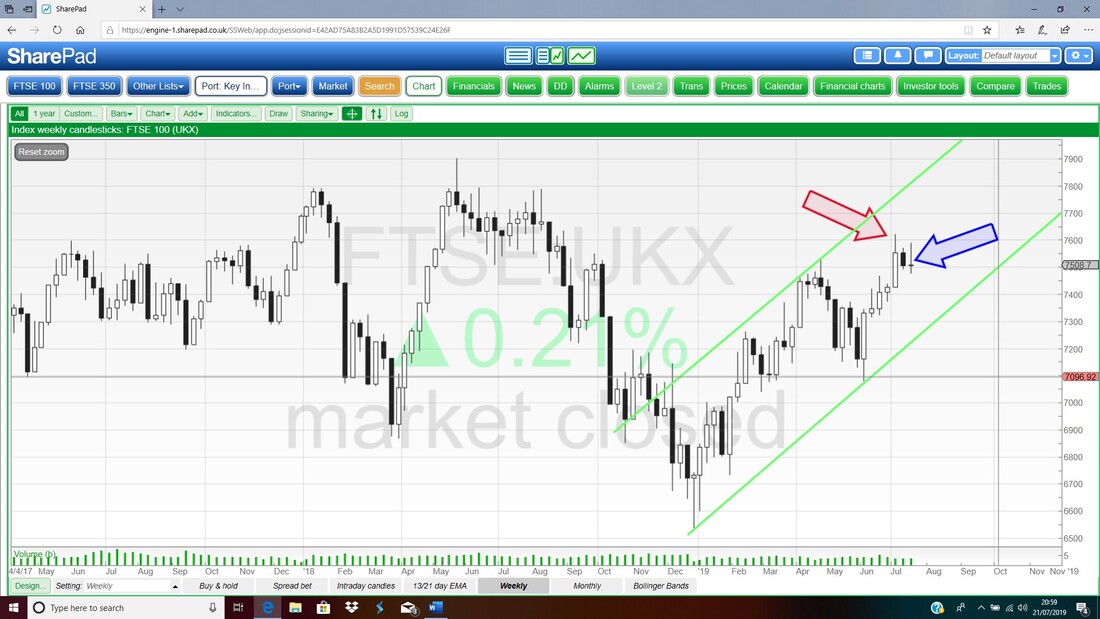
Next on the Bollinger Bands around the FTSE100 Daily Candles, my Blue Arrow is pointing to where the Candle from Friday touched the Bottom Band and then started moving up. That suggests we might get more upside in the short-term but of course there are a few contradictory signals from what I have shown already.
Major Downtrends
Probably many months ago now I showed the Chart of Pets at Home PETS and pointed out how it was in a Major Downtrend Channel and was starting to move sideways out of the Channel and this was a precursor to things getting better. As it happened, I got this pretty right and we have been treated to a big move up on PETS and I am very pleased I stuck with it. This is entirely normal on decent Stocks that have a bit of size and the usual pattern over years is that they go into Uptrends, then Downtrends, then Sideways Ranges, then Uptrends and then perhaps a bit of Sideways and then Downtrends and then………I am sure you follow my drift. So on that basis, I wanted to point out some Charts in big Major Downtrends that I hold and some are looking interesting. AA. This one is probably the most hated Stock on the Market and it has a huge pile of Debt so I would suggest no one goes near it for now but what I am expecting at some point in time is a Rights Issue and once this happens I suspect we will see the Recovery (there’s a pun there !!) start. Anyway, on the Chart, there is a very clear Long-Term Downtrend Channel and we need the Price to escape through the Black Line marked by my Black Arrow. At the moment there is little sign of this happening so keep away from this one for now. 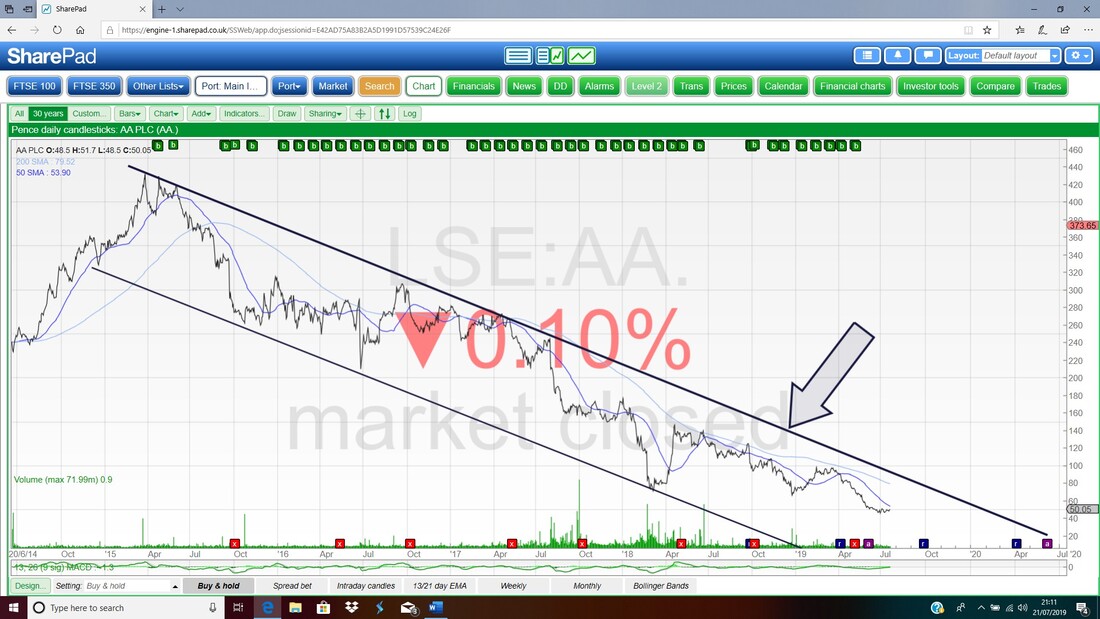
Hostelworld HSW
There is a lot happening on this Chart. We had the Downtrend where my Red Arrow and Red Line are which was broken free of and then it did quite well for a while but now it is dropping back again. The key here is that my Black Support Line (marked by the Black Arrow) at just a shade above 160p must hold. If things are looking up, we will see the Green Line marked by my Green Arrow broken through. For now it is best avoided but it does have a Dividend Yield near 7% but with all the economic worries and suchlike there is risk it could be cut. No rush. 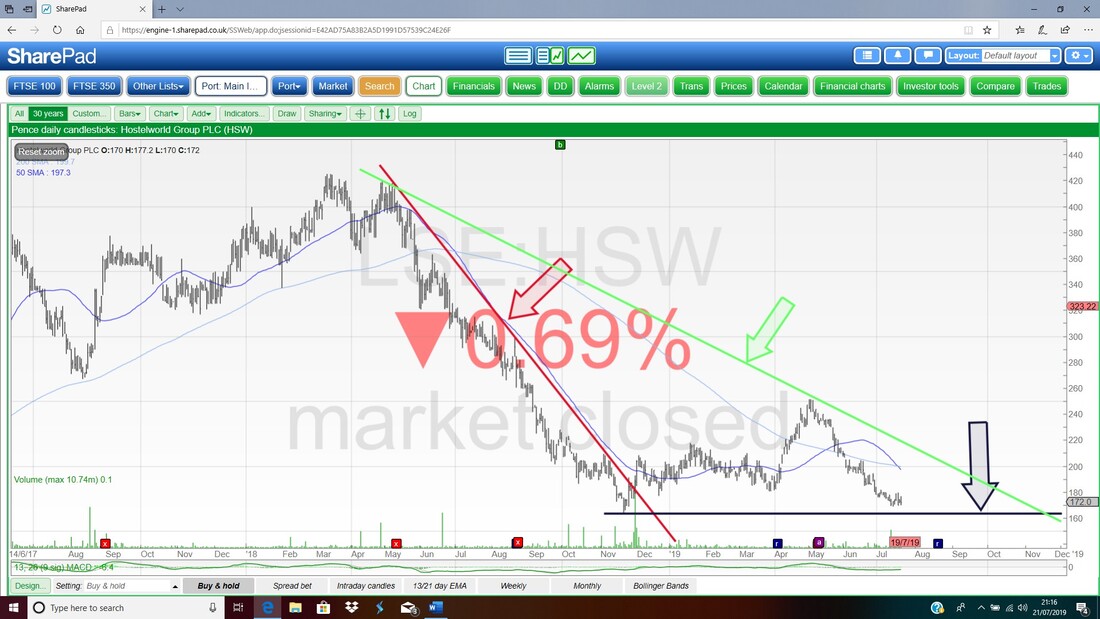
Superdry SDRY
On this one the Price escaped the Downtrend marked by my Black Line where the Black Arrow is and since then has gone mostly sideways. To the downside it is important that the Low from December 2018 at about 350p holds. Look how the faster 50 Day Moving Average which is the Darker Blue Wavy Line pointed at with my Red Arrow is moving towards the Lighter Blue Wavy Line which is the 200 Day MA marked by my Blue Arrow. We might get a Bullish Golden Cross here. A move up over about 580p would make me think things are improving here. 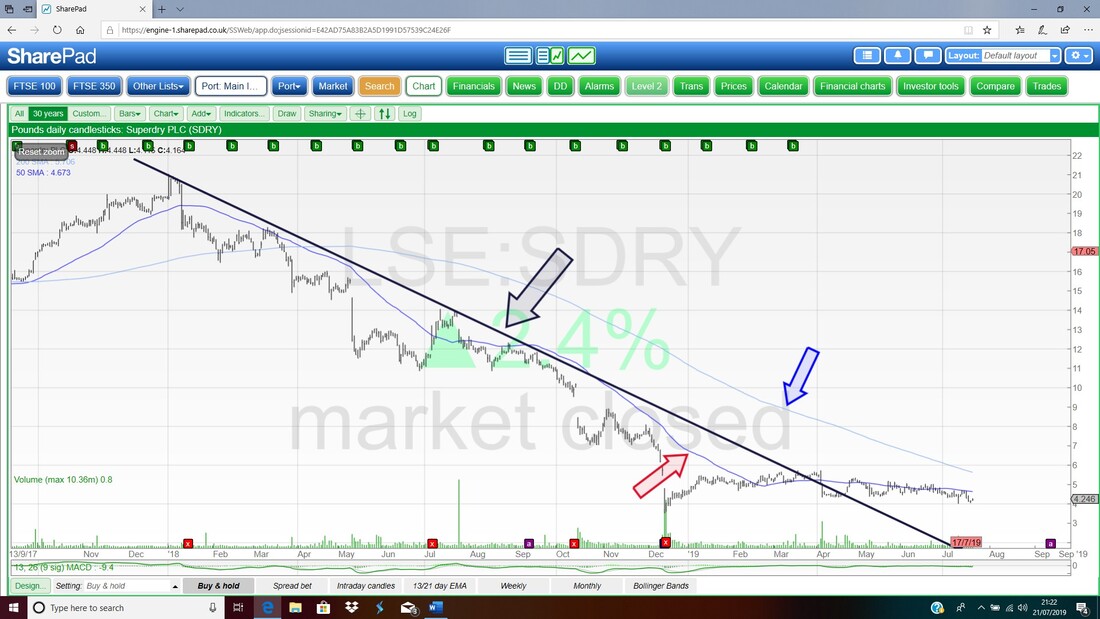
igIndex IGG
This one is noteworthy because it has Results or something on Tuesday and it has a lot of Cash and a Dividend Yield of about 7%. First off look where my Black Arrow is how we are near a Bullish Golden Cross between the 50 and 200 Day Moving Averages (the Blue Wavy Lines of different hues) and the key to be really confident is a move up above the Green Line (marked by my Green Arrow) at about 685p. Note there is a ‘Gap’ above this Green Line which is marked by my Red Arrow and you tend to find that these Gaps close fast once the Price gets into them. If there is good news on Tuesday (or perhaps even if things aren’t getting worse) we might see a move here. Right, that’s enough for tonight – good luck in the coming week and be careful out there in the wilds of the Markets. Cheers, WD. 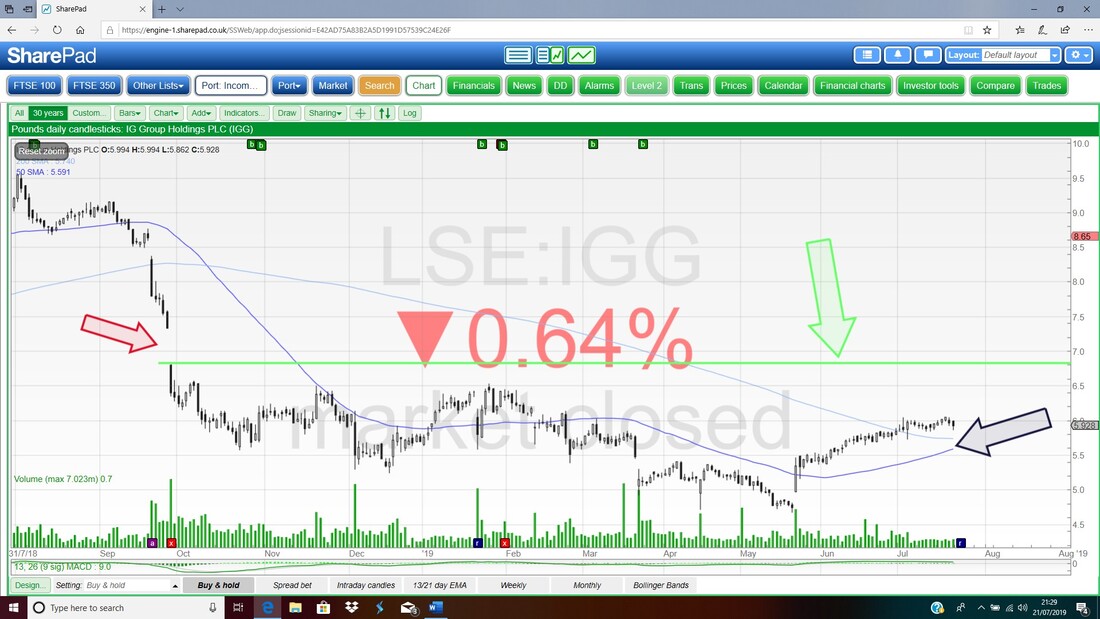
0 Comments
Leave a Reply. |

Stocks & Markets WheelieBlogsThese tend to be more Markets and Stocks related and timely - the Blog Page on the Main WheelieDealer Website has the 'Educational' stuff (well that's the theory anyway !!). Archives
October 2021
Categories
All
|
