

|
stocks & Markets blog |
|
Don’t worry, that’s not my words !!
I caught most of that Peter Jackson WW1 in Colour thing which was on BBC2 on Saturday Night and was extremely impressed by it. I remember seeing this recently on the BBC News and the essence was that Peter Jackson had got a team of IT Wizards to take original WW1 film footage and then to ‘colour’ it and also where there were people speaking he got a lip-reader to decipher what was being said. They then took this new colour footage and put in representative voices for the speaking bits and also overplayed explosions and bullet noises and tanks rumbling etc. to make it extremely life like and sort of ‘up to date’. It is astonishing how much this transforms the previous Black & White footage into something so real and it makes you much more able to ‘relate’ to the Soldiers etc. involved and it without doubt increased my understanding and appreciation of what the Trenches and stuff would have been like. However, it doesn’t include ‘SmelliVision’ and I would imagine this is a godsend for viewers because as much as we crave realism, the awful stench of rotting flesh must have been utterly all consuming and truly miserable.
Oh, I forgot to add that they also voiced over interviews of many former ‘Tommies’ and this again adds a huge amount to the film. As much as we all think about the horror and death and destruction of the Trenches and ‘going over the top’ into No Man’s Land, like all Wars and truth is probably more along the lines that it was immense and seemingly endless periods of boredom interspersed by short moments of utter terror (this is a description I have seen/heard/read about many many times). In line with that, there was clearly a lot of ‘Gallows humour’ and general banter and you got the impression that when they were not involved in the horrific battle action, they had quite a laugh.
And indeed this is something that comes across a lot from this film and if you were to work out the percentage of footage that is involved in Battle scenes then it might only be 15% or something but the footage about things ‘away from the Front Line’ is highly insightful and because of the way this has been reformatted it gives such realism to what was happening. For example, there are loads of bits about visiting Brothels and stuff and the absurdity of not being able to wash for weeks and weeks and being caked in mud and far worse and ridden with lice, to then find that you go back to the ‘Rest Areas’ and are having to polish your boots and wash your uniform and suchlike so your Generals can do an Inspection and the paradox is quite stark. There are some quite amusing bits about the woeful toilet facilities and men falling into the cess pits and on the other hand there are truly awful bits about men falling off the ‘Duck Boards’ and into the mud in the Trenches and then just sinking out of sight. Anyway, I could go on all night but it really is worth watching and you should be able to find it on BBC iPlayer or whatever they call the app these days. Before I move on I better explain the title of this Blog - this is something that really hit me right at the end of the film. It was quite amusing because one of the voices of the interviewed men put over the point that there was a guy in their Regiment, or whatever division of the Army it was, who was always known as the ‘Rumour Man’ or some name like that - and he was the guy who just seemed to know everything that was going on. Anyway, he had heard that the War would be ending with an Armistice on the 11th of November 1918 and the men got all excited and then when they checked the actual date it was already the 11th. So the War was over and they didn’t even realise. However, there was surprisingly a general feeling of “deflation” and feeling a bit lost and uncertain as to what was now in their futures. You have to remember that these men were extremely young and often the guys who were in their mid-20s were the “Old Men” and for most of them they had almost gone straight from School, College, or their first Jobs into the horror of the War. Most of them felt numb and dumbstruck and had a sense of loss. It’s like however awful the War was, they had a sense of comradeship and bizarrely ‘fun’ and really felt that going home held huge uncertainty and would never be as intense as what they had been through. Once they got home, there was a common sense that People who had not been involved in the fighting knew nothing about what they had been through and were simply not interested. The Troops soon felt like a ‘breed apart’ and they could only discuss stuff with other Soldiers. It also got worse because many Employers would advertise Jobs and say “No Servicemen need apply” which is pretty shocking when you think of the damage done to these young men and the sacrifice so many of their peers had to pay. I had never appreciated these final sentiments and the film is excellent for this understanding alone. Last Week My Portfolio took quite a hit Last Week and was down 1.6%. From memory I don’t recall any particularly big moves from my Stocks but I think the pain was inflicted by my Short FTSE100 Positions in the main because I had that irritating combination where my FTSE100 Shorts were hurt by the Index rising but my Long Portfolio of Stocks didn’t do much to offset the hit. Anyway, that is the nature of Hedging as you can never get a ‘perfect’ Hedge (and the FTSE100 has big ’Weighting’ problems) and I am happy to keep going with my Strategy of pretty much Hedging-out a big proportion of Market downside risk which I think is very real with the nonsense around Brexit. For the Month of January my Portfolio was down 0.25% which is obviously not much really and on the face of it this means my Hedging is almost exactly in ‘balance’. However, that is not necessarily a true picture because it includes the large hit of something like 4.6% which was inflicted by Patisserie Valerie CAKE going pop on me and if you ignore that my Portfolio would have been up just over 4% so my Hedging is probably not as in balance as it appears. Also my Numbers do not include my Income Portfolio and I have not got around to checking it lately but I suspect that gained on the Month. I am relaxed about this as ideally I would like my Hedging to be perhaps around 30% or so of my Long Portfolio - so the bias is still mainly on the ‘Long’ side of things - and I am probably not far off this in reality. So in terms of my Strategy I see no need to change anything. There is a huge risk that we end up with a ‘No Deal’ Brexit and I suspect this would cause both the Pound Sterling and the FTSE100 and Stocks in general to fall heavily and if we miraculously get a ‘Deal’, then that would probably cause Sterling to shoot up and that could hurt the FTSE100 - so any way I consider it being Short on the FTSE100 seems a reasonable stance. We are now something like 8 Weeks away from the official Brexit Date and although an Extension of Article 50 might happen, it is perhaps unwise to rely on this happening. It strikes me that the Market is being highly complacent at the moment and is not discounting some pretty bad outcomes if things do not go well. 8 Weeks might seem like quite a bit of time but I suspect that as we get nearer to the ‘Leave’ Date of the 29th March 2019 then the Markets are likely to get a lot tougher - and we all know that ‘Time flies’…….. With the demise of Utilitywise UTW and CAKE exploding on me, I have 2 spare ‘Slots’ in the WD40 now but I don’t have much Cash to buy anything with anyway. I am in no rush to fill these Slots although I have plenty of good candidates (for example, both Litigation Capital LIT and Ramsdens Holdings RFX look very good but these are in Simon Thompson’s ’Bargain Stocks’ so it would be unwise to buy them immediately because they will probably move up in coming Days following his Article in Investors Chronicle. However, once the dust settles and they ease back, they could be worth looking at) and I want to see Brexit resolved first before I do anything. I have plenty of Stocks so there really is no need to rush into anything and of course it is not just the Brexit worries that are holding me back - Italy officially when into Recession last Week and Germany is barely growing at all. We had very strong Jobs Numbers from the US on Friday but this might not be helpful if it means that The Fed keeps raising Interest Rates - that could hit the US Stockmarket especially. There just seems to be a lot more Uncertainty around in the Global Economy than we have had in recent Years and I think being cautious is the right approach. Blog Slate Last Week I published the first Part of those Blogs on Macroeconomics that I have been going on about and on Friday Night I made pretty good progress on developing the remaining Parts and I think now these will stretch to 4 Parts because I have broadened it out from just talking about an ‘Economic Spectrum’ and have been adding in principles like Monopolies, Free-Rider Problem, impact of Regulation etc. and the Blog Series will be more of an ‘Introduction to Macroeconomics’ really. Part 2 is in good shape so that should get published in the coming Week. About a Week ago we issued the latest TPI Podcast and if you skip over to the ‘Podcasts / Videos’ page which sits on WD2, then you should be able to find it right at the top. This Podcast should give a bit more colour on my thinking around Brexit and we also discuss quite a few Stocks in it. Blast from the Past One of my reasons for being a bit dubious about the Rally in the Markets that we have seen so far in 2019 is that to me Valuations are still quite high on some Stocks and this particularly applies to the Nasdaq where many Tech Stocks look to me like being on daft Valuations. With this in mind, I thought it would be worth chucking in the Series I did on how to Value stuff and although many Readers will have seen this plenty of times, I am sure there are new Readers who have yet to suffer it (and I hate seeing People escape from such pain !!). So here is a Link to the Final Part of the Blogs and if you scroll to the bottom of it you will find Links to the first 3 Parts: http://wheeliedealer.weebly.com/educational-blogs/valuation-valuation-valuation-bursting-for-a-pe-part-4-of-4 Let’s look at the Charts then because in both the UK and the US there have been some interesting developments last Week. S&P500 I am particularly interested in this one because I have a Short Position on it but it is much smaller than the Shorts I have on the FTSE100 - however, I did notice that on Friday there was quite a Reversal intraday - this could be a Bearish Signal and I want to see how the other Indicators and stuff look. As usual all the Charts I show here are taken from the outstanding SharePad Software stuff I subscribe to (actually it is wrong to call it “Software” because it is a Cloud-based thing so I just access it through a Website) and if you click on them the images should grow bigger on your Screen so you can actually see some detail. First off here is a fairly messy screen that has the S&P500 Daily going back just over a year. Please ignore most of it but what I am pointing out here is that the Price has now moved up through that Red Resistance Line which is marked by my Red Arrow but it now faces a lot of Resistance from my Blue Ellipse which shows a Zone of Resistance up to about 2815 or so. It is also a positive sign that the Price is back up into the Range between my Green Parallel Lines and in particular it has got above the Bottom Line which is marked by my Green Arrow. Note also the Lighter Blue Wavy Line which is the 200 Day Moving Average is quite flat now and the Darker Blue Wiggler which is the 50 Day has been falling but looks like it is trying to level out - if it turns up that would be good. That 200 Day MA Line could be Resistance though at about 2750. To get really Bullish we need the 50 Day MA to cross the 200 Day MA from underneath - it is a slow indicator but it would be a good sign for Bulls. 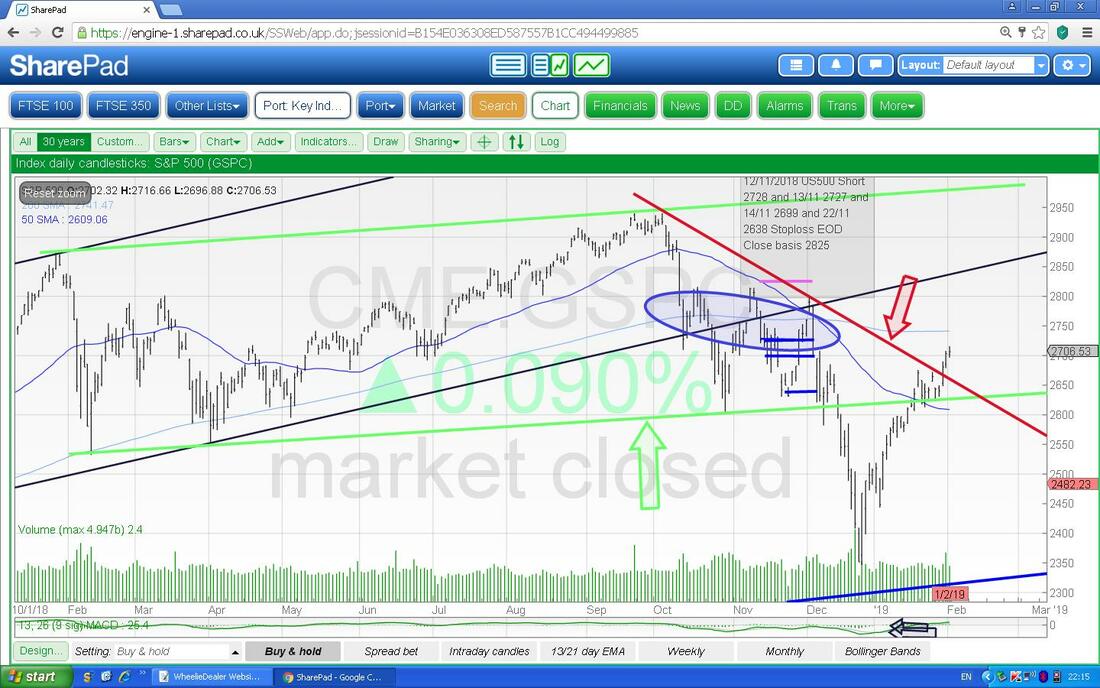
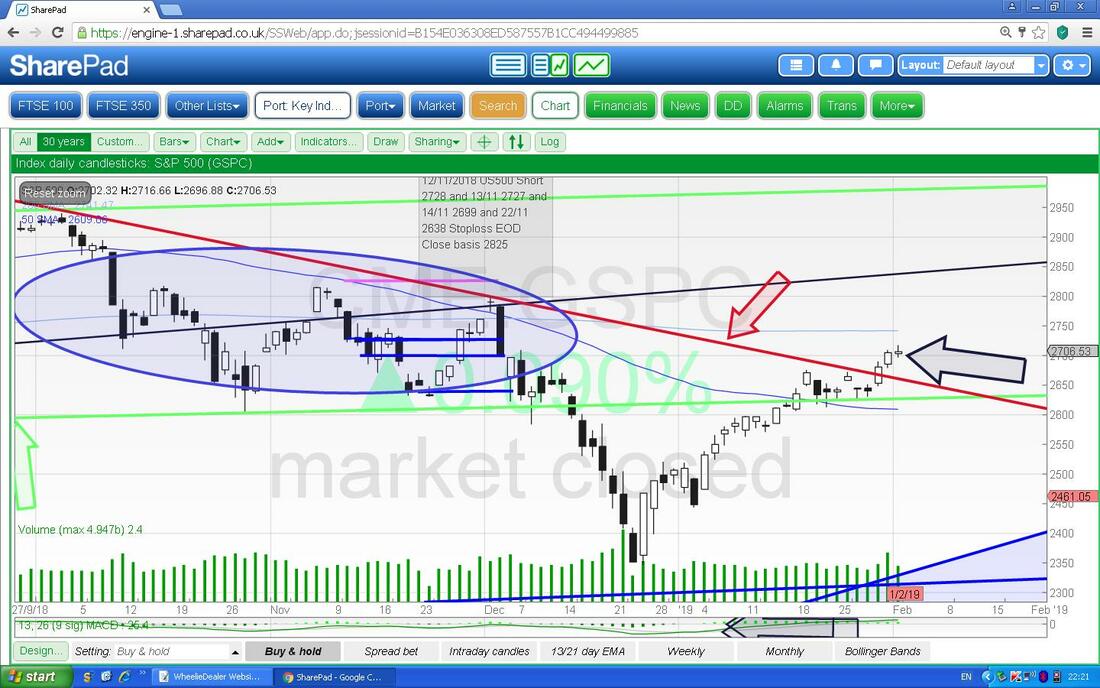
I have now zoomed in on the above Chart (it is dead easy with SharePad - just a click and drag thing with the Rodent) and this is showing the Doji Candlestick from Friday which I am pointing at with my Black Arrow - this could be a turning point down but we won’t know until Monday obviously.
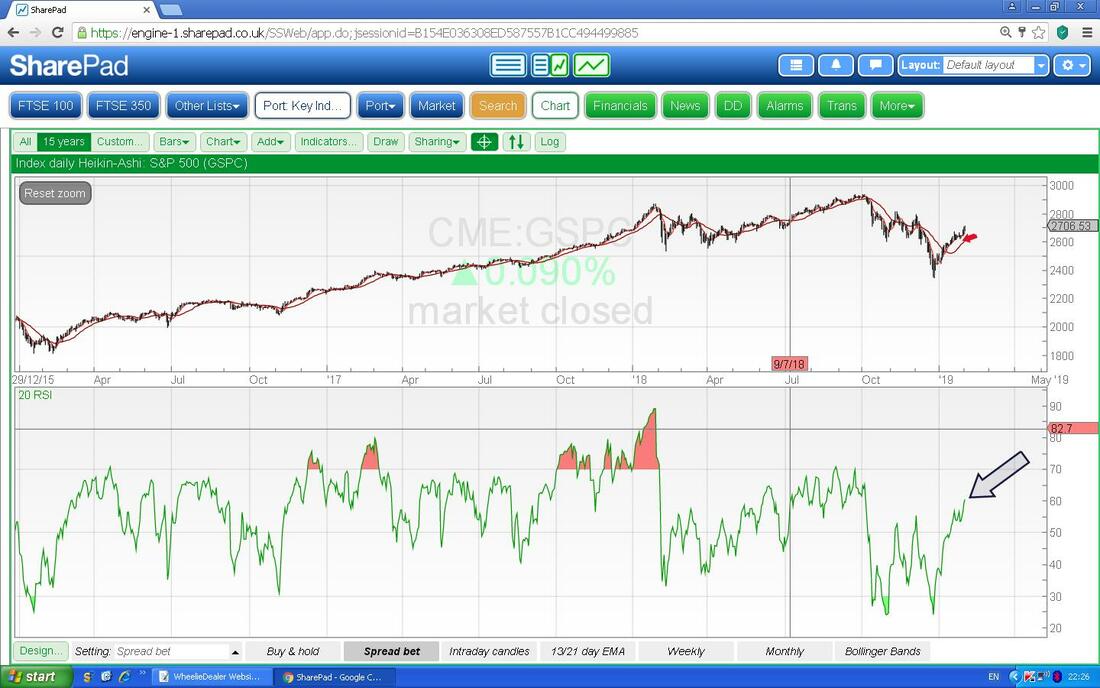
In the bottom window on the Screen below we have the Relative Strength Index RSI for the S&P500 Daily. On a reading of RSI 61 it is not particularly high but if you look to the left it has often turned down from this level in recent times. In general RSI 70 is seen as ‘Overbought’.
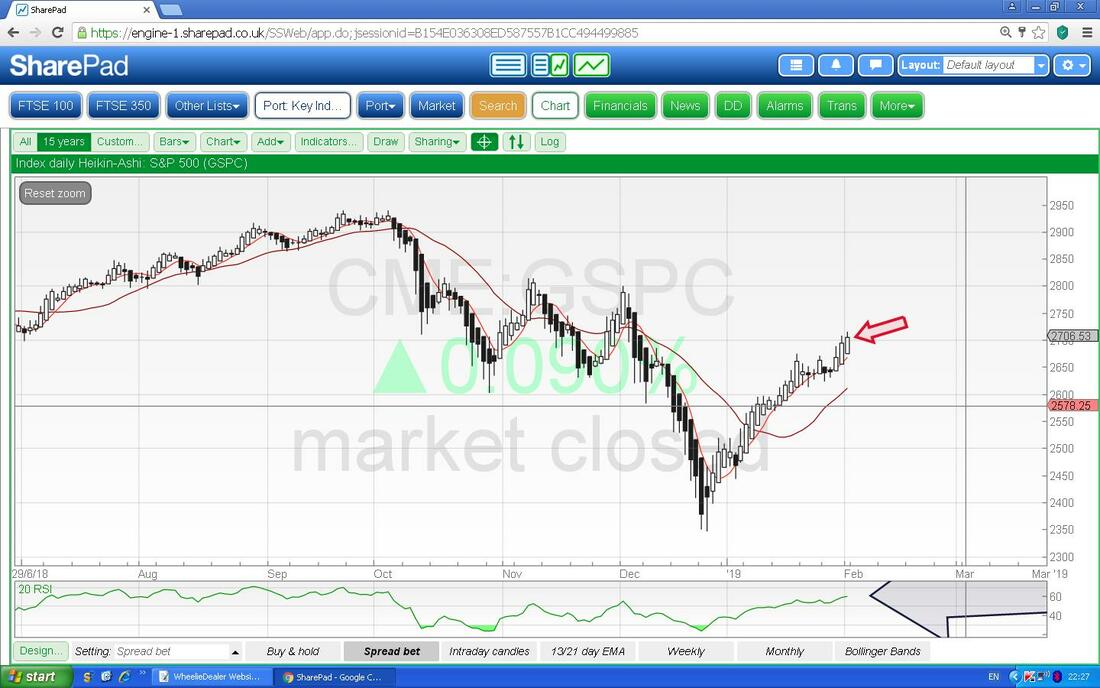
On the next Chart we have the Daily Heiken Ashi Candlesticks - these are totally different to ‘normal’ Japanese Candlesticks but are very simple to interpret. My Red Arrow is pointing to a Big White Up Candle from Friday and this is bullish but it must be appreciated that HA Candles are a ‘slow’ Indicator as they form up over 2 Days (this has the huge advantage of removing a lot of ‘Noise‘).
Next we have one of my favourite Indicators. My Red Arrow is pointing to where we had a Bullish Crossover between the Black 13 Day EMA (Exponential Moving Average - like a ‘simple’ MA but Weighted to more recent moves) and the Red 21 Day EMA. This means that the 13/21 Day EMA is in ‘Bullish Mode’ and we could get more gains until we get the opposite which is a Bearish Crossover - we had one back where my Black Arrow is.
This is my ‘Working’ Screen for my Short Position and the Box on the Left is like the Ellipse which I showed on the earlier Chart and highlights a Zone of Resistance. 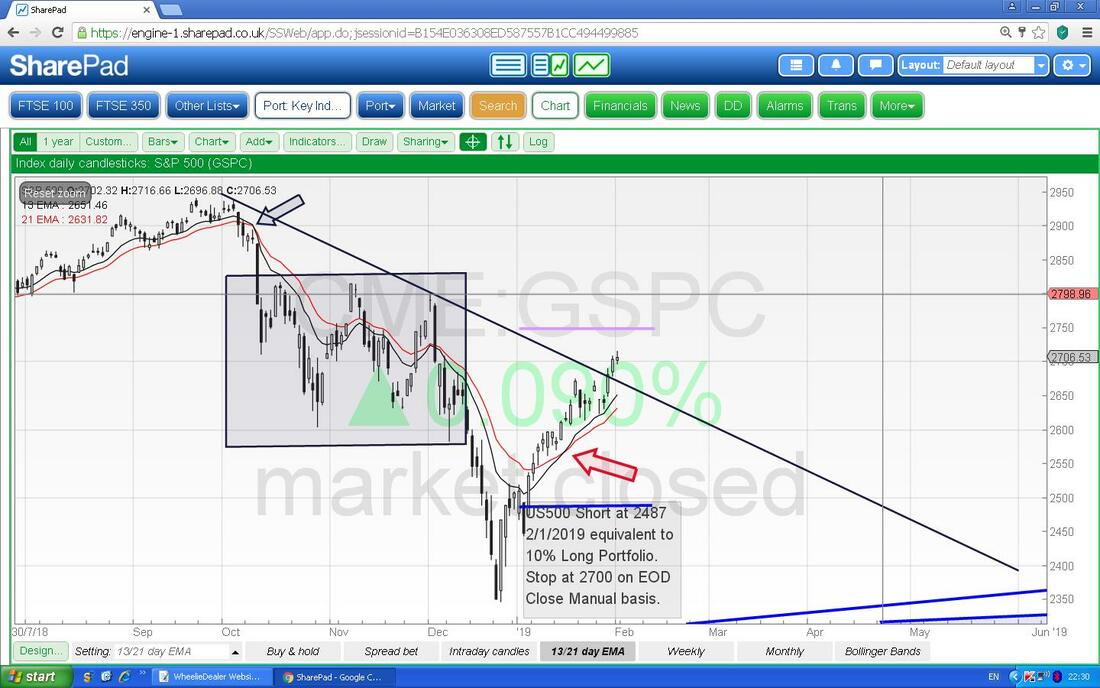
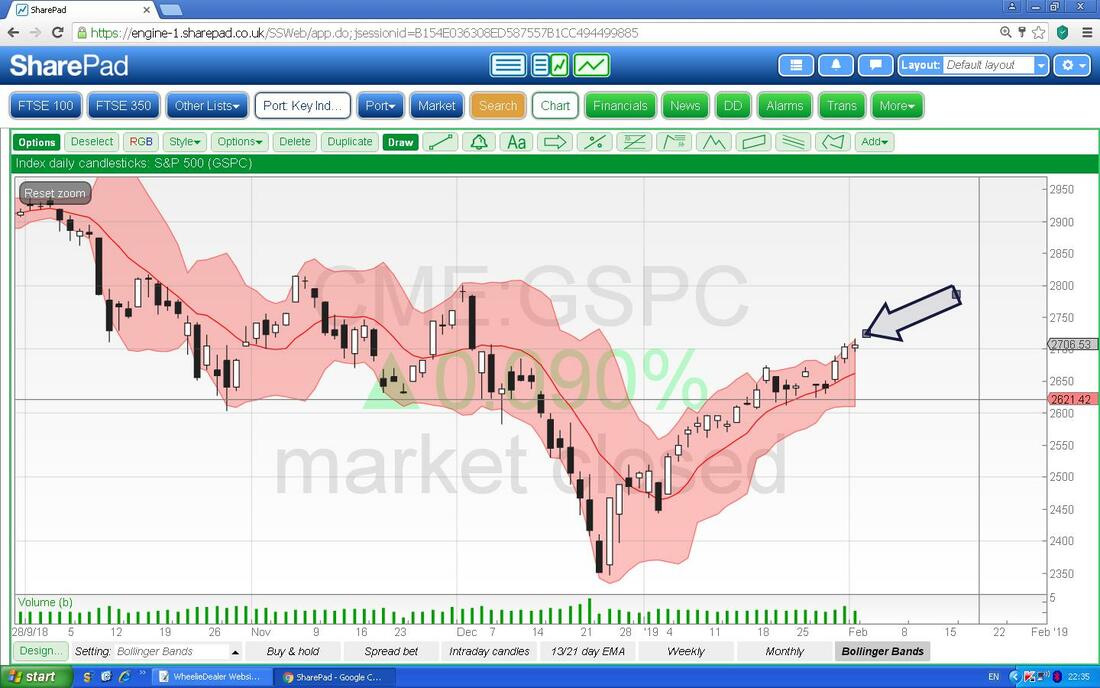
On the next Chart we have the Daily Candles and the Pink Zone marks the Upper and Lower Bollinger Bands. My Black Arrow is showing where we are now at the Top of the Range and this suggests a good time to drop back a bit or to go sideways.
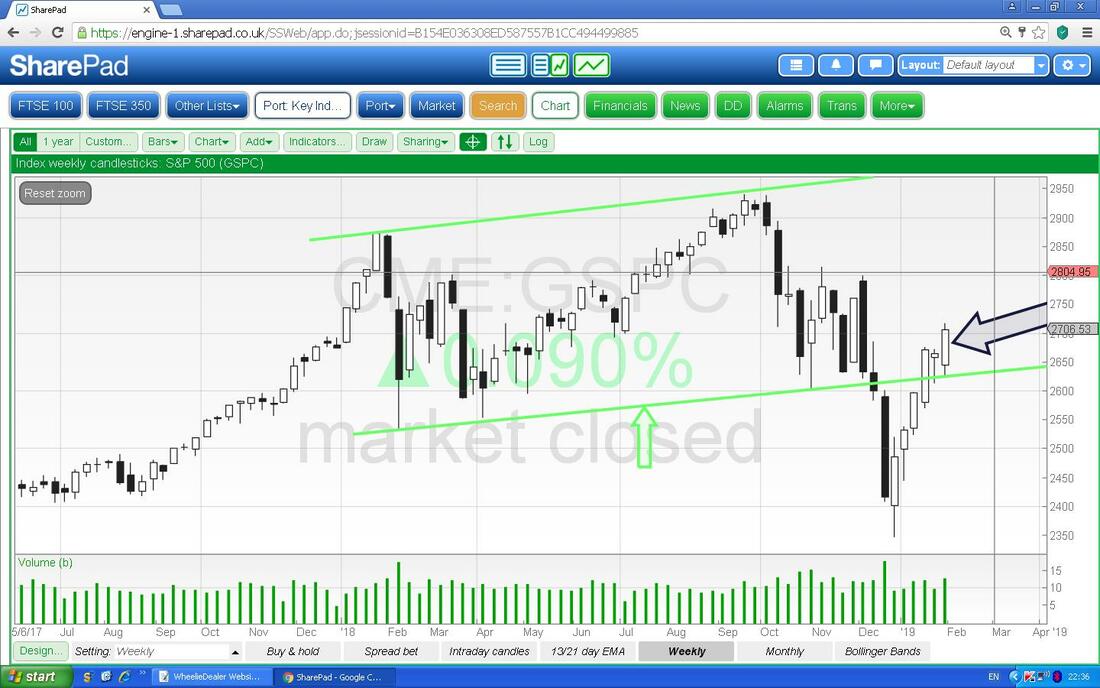
Next we have the Weekly Candles for the S&P500. My Black Arrow is pointing at a Big White Up Candle and this is bullish.
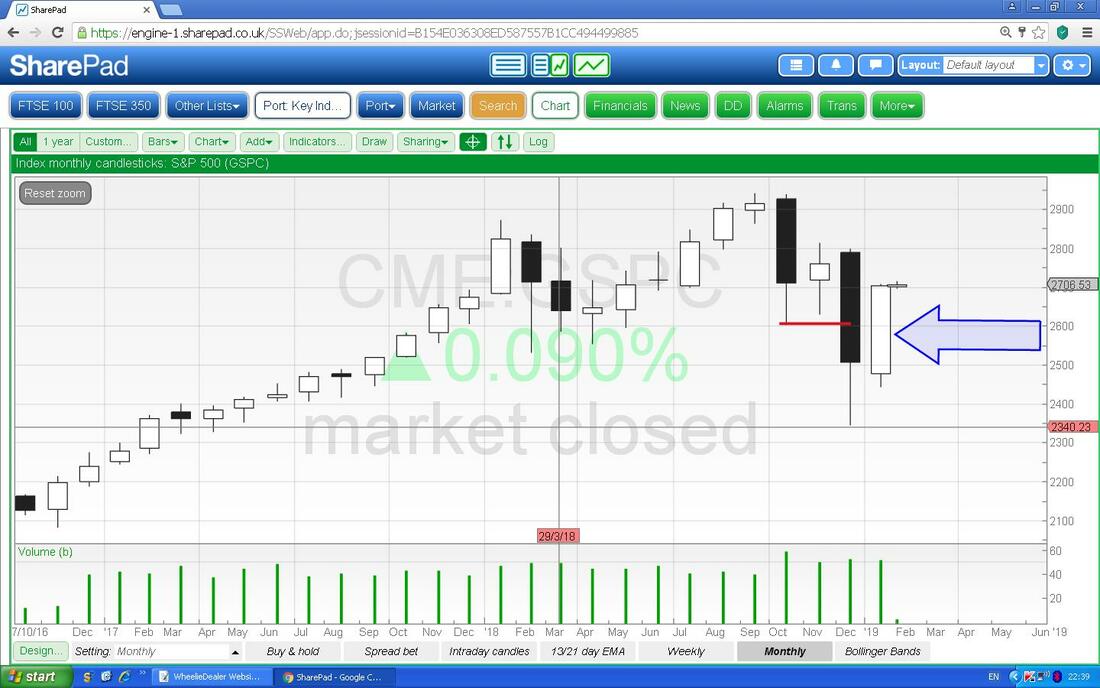
And finally we have the Monthly Candles. My Blue Arrow is pointing to a Big White Up Candle for January and this is Bullish really. Ignore the tiny Candle that appears after this - that is the start of February and is not valid until we get the Full Month.
Nasdaq Composite
This Tech Index is particularly interesting because many of the Stocks look pretty meatily valued and to a large extent rises in the Nasdaq have driven the S&P500. On the Chart below we have the Daily Candles and my Black Arrow is pointing to where we had a small Doji Candle on Friday (if you look close it is a bit like a Hammer) and when combined with the Big Up Candle from Thursday, the combination is pretty Bearish looking and could be marking a Turning Point. Note how similar the Nasdaq Comp is to the S&P500 - again it is just above the Darker Blue Wavy Line 50 Day MA and the Lighter Blue 200 Day MA. 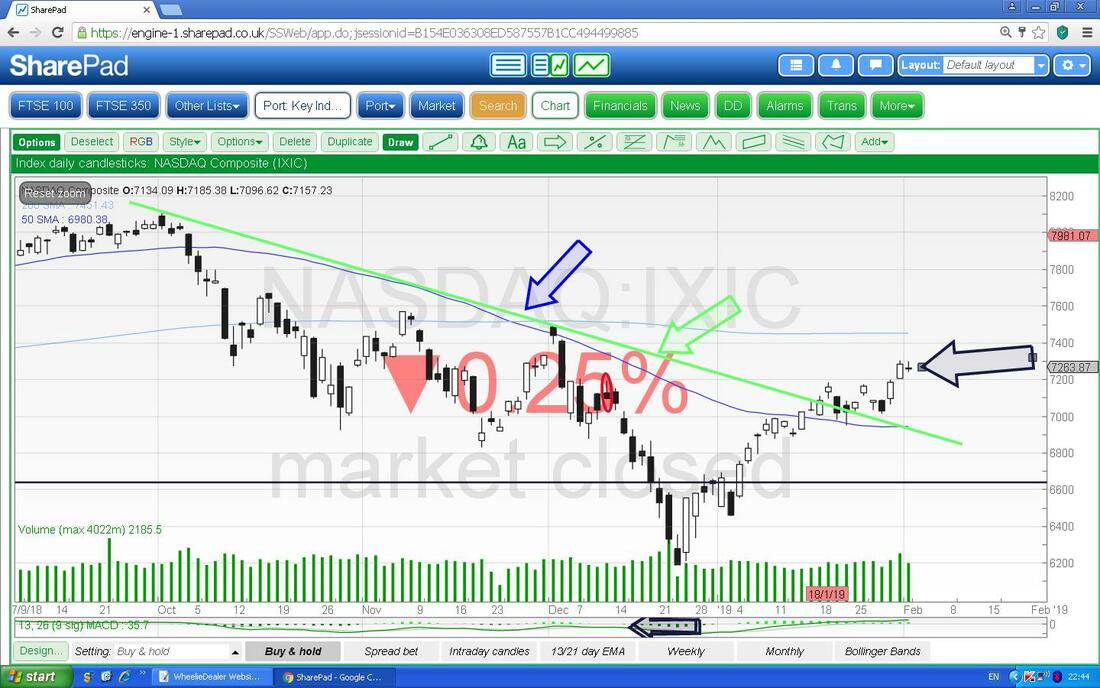
In the Bottom Window on my next Screen we have the RSI for the Nasdaq Comp Daily. On a Reading of RSI 60 it is not overly high but could be a level where the Price drops back from.
Other than that the Charts on the Nasdaq are extremely similar to the S&P500. 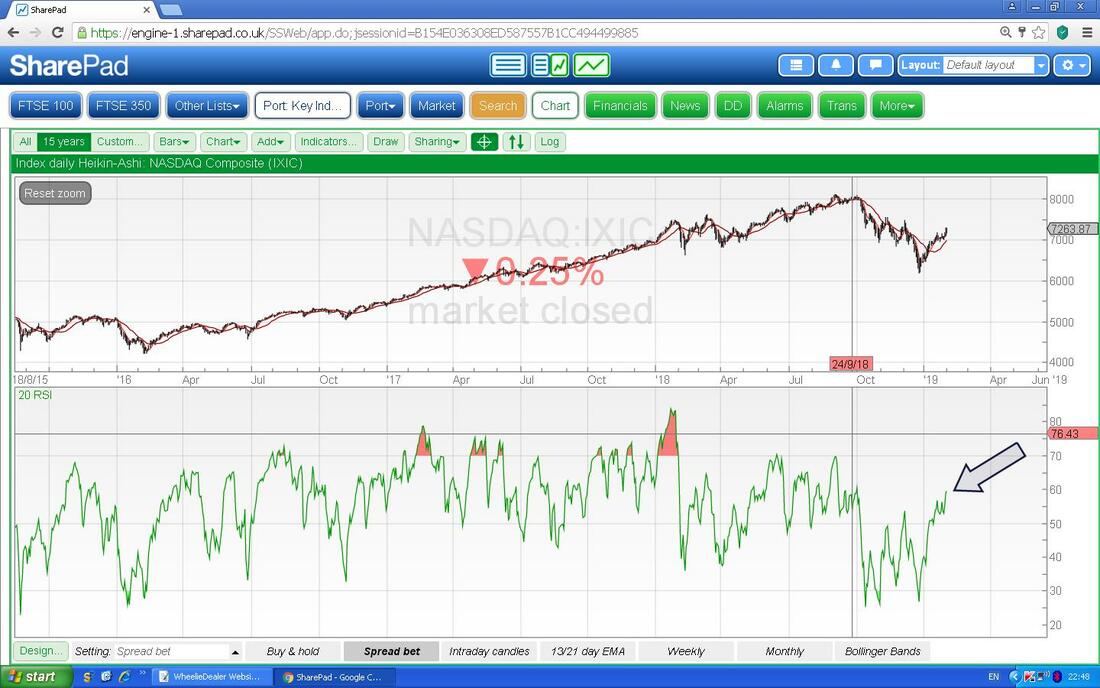
FTSE100
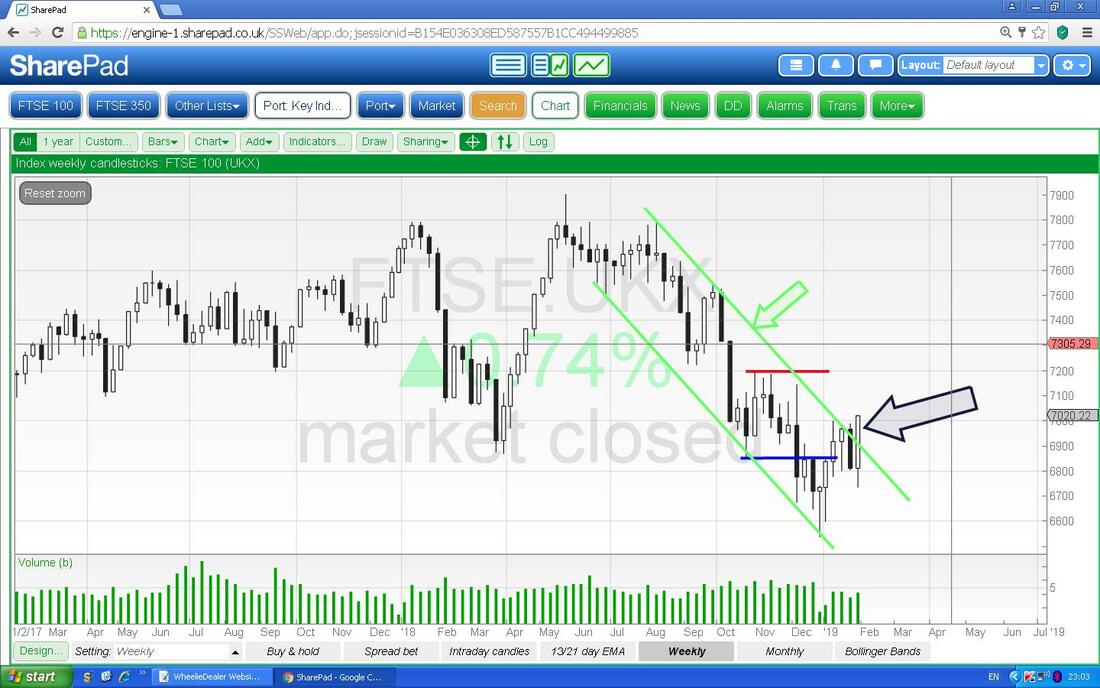
This is my Working Screen for my FTSE100 Shorts and therefore there is a lot of stuff on it. Anyway, try to find the Green Arrow as this is pointing to a White Up Candle from Friday and the key thing here is that it has broken-out above Resistance at 7000 which is a bullish development. The Price is now back into the Range between my Black Arrows and there is Resistance up at 7200 at the Top of the Range. At the moment I have a Stoploss up above this 7200 Level but I might not trigger it if and when it hits. What I am thinking is that my Hedge is more of a circumstance and time thing and I am not too fussed if my Portfolio of Stocks rises as the FTSE100 rises - overall I should not be losing Money and that is what I am more concerned about (think of the Hedges as if I had just sold a load of Shares and gone into Cash - like the recent Blog Series I wrote). Note the 200 Day MA (the Lighter Blue Wavy Line) is still falling but quite flat but the Darker Blue 50 Day MA is still very much falling which is not so good for Bulls. 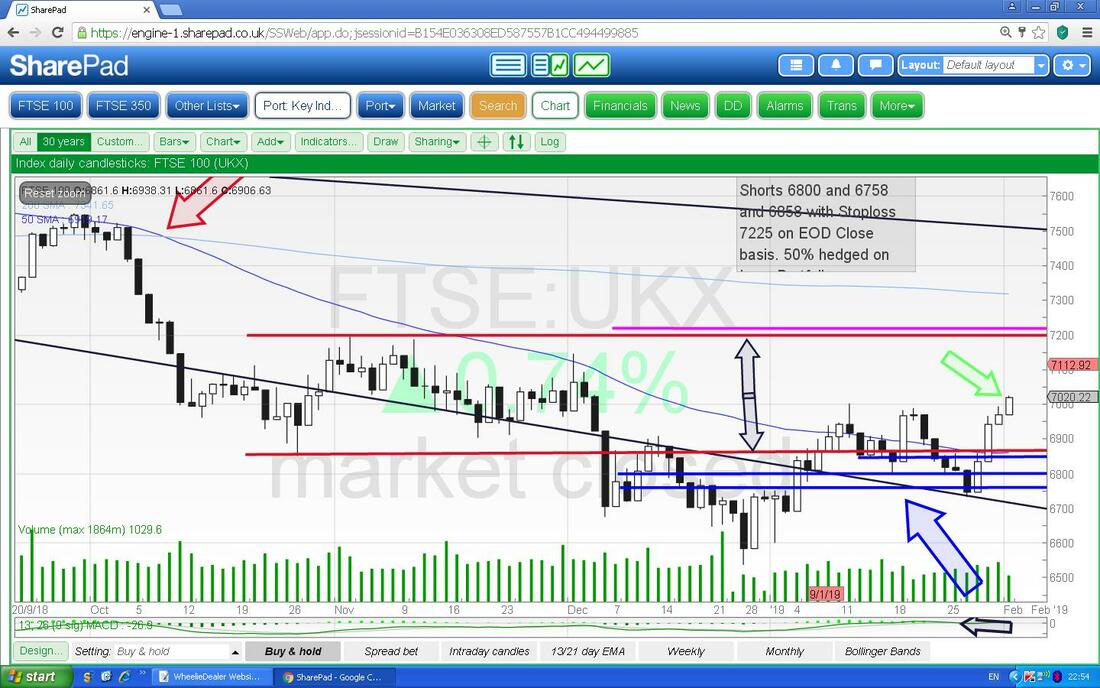
In the bottom window below we have the RSI for the FTSE100 Daily. On a Reading of RSI 57 it is not all that high and can rise a lot more.
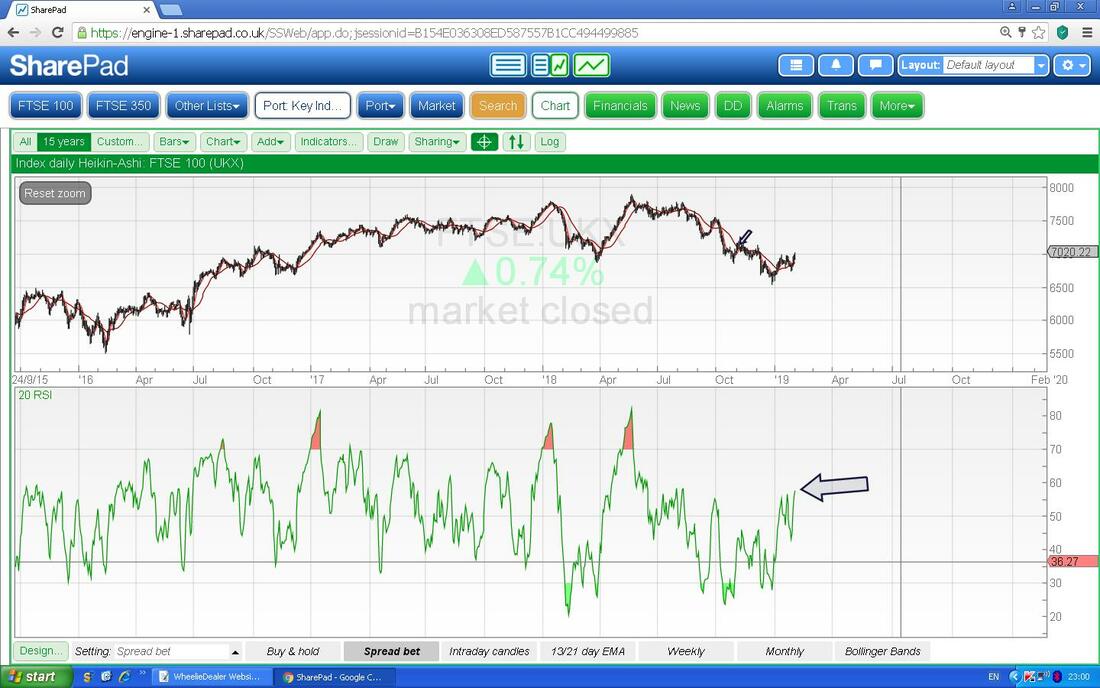
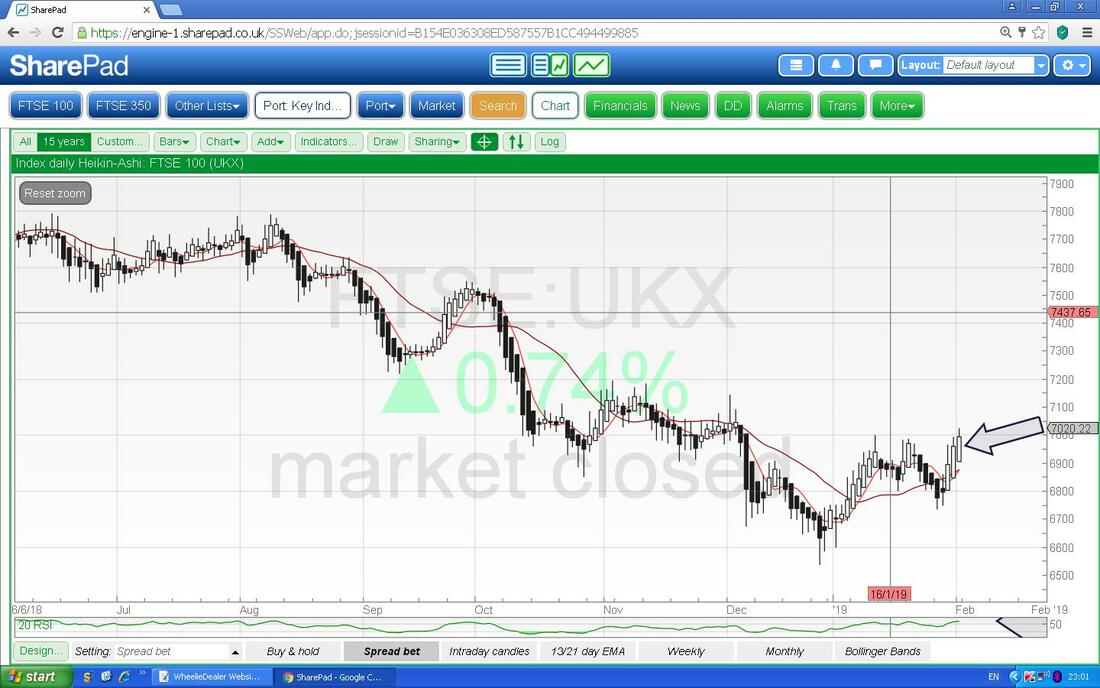
On the next chart, my Black Arrow is pointing to a Big White Up Candle on the Heiken Ashi jobbies - that is bullish.
On the next Screen we have the Weekly Candles for the FTSE100. My Black Arrow is pointing to a Big White Up Candle and this has ‘Engulfed’ the Candle from the previous Week and this is Bullish.
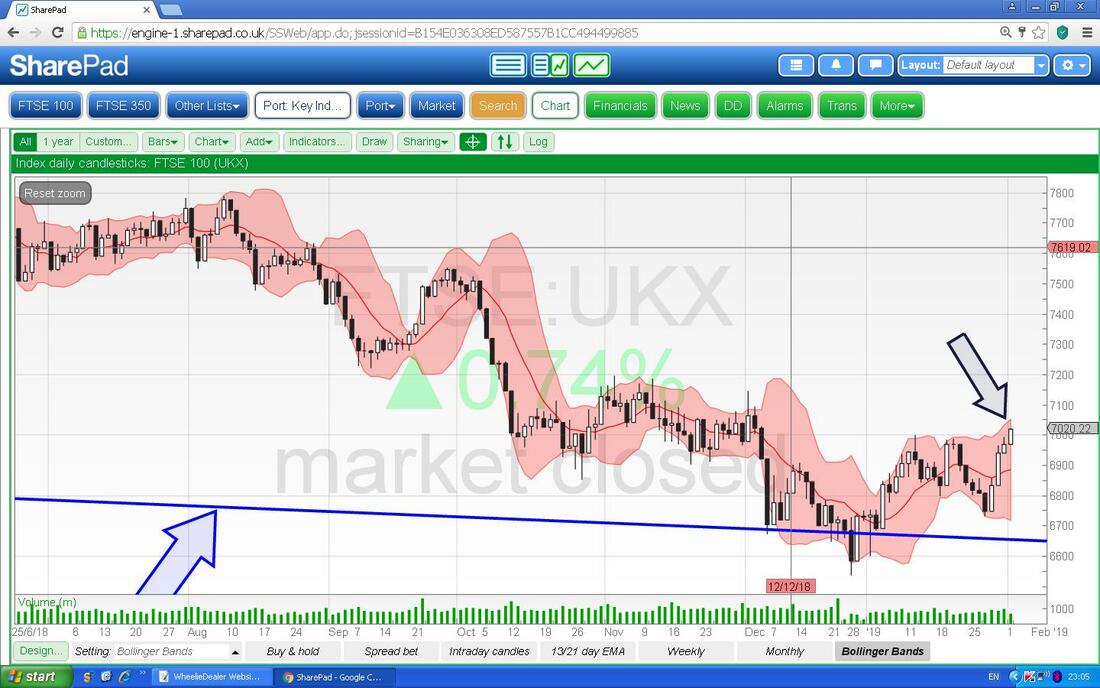
The Next Screen has the Daily Candles with the Bollinger bands above and below. My Black Arrow is showing how the Price is up near the Top Band which might mean it needs to go Sideways for a bit or to ease back.
FTSE250
Lastly I will show you the Monthly Candles for the FTSE250. My Black Arrow is pointing to a Big White Up Candle for January (please ignore the little ‘February’ one) and also note that 19000 is Key Resistance on this Chart now. OK, that’s it for this Weekend - good luck in the coming Week, Cheers, WD. 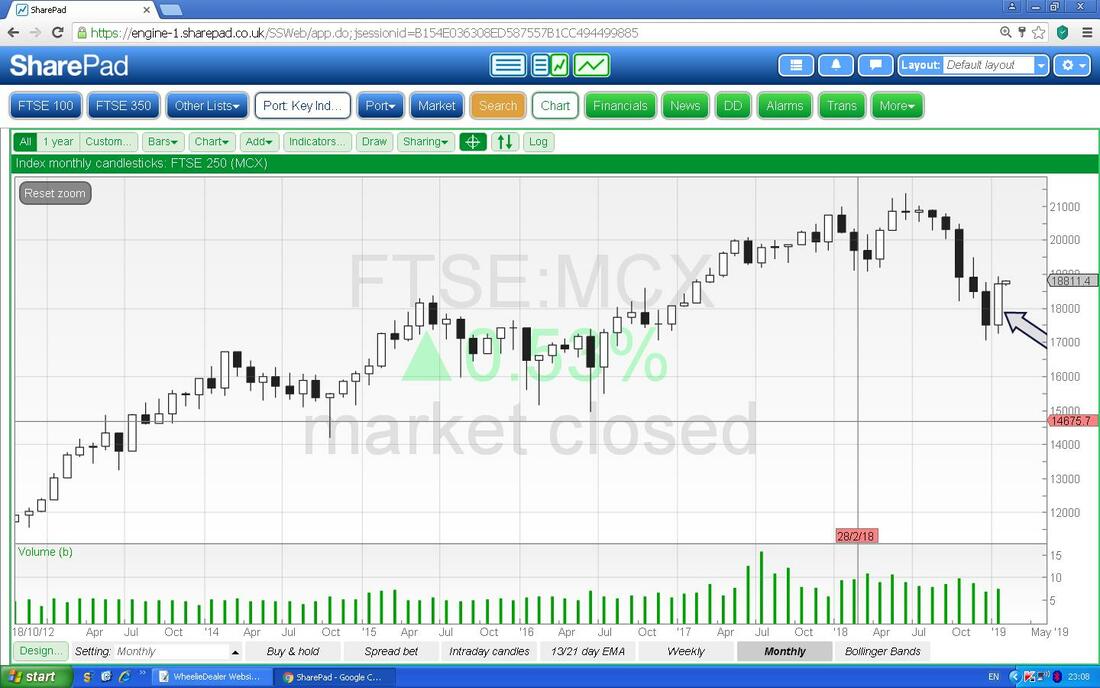
0 Comments
Leave a Reply. |

Stocks & Markets WheelieBlogsThese tend to be more Markets and Stocks related and timely - the Blog Page on the Main WheelieDealer Website has the 'Educational' stuff (well that's the theory anyway !!). Archives
October 2021
Categories
All
|
