

|
stocks & Markets blog |
|
A chaotic Week for me just gone with a bit of a shock visit to A&E on Monday Night where I stayed from 9pm to 6am only to pretty much find out there is absolutely nothing wrong with me !! This of course screwed up any plans I had for the Week and delayed me producing Part 2 of the HOTC Blogs although there was a slight bit of upside in that it has inspired me to produce a very personal Blog about what happened and it contains important lessons on how our psychology can lead us to make very bad decisions and assumptions and how this is exaggerated by lack of sleep. That Blog is fairly complete and will probably appear this Week – I think Readers will find it quite amusing in parts although at the time I can tell you it was not very funny with me seriously thinking my Heart was knackered !!
Before I get stuck in I must just mention the Meet-up we are doing at Gaydon Motor Museum on Friday 12th July. I have written a bit more further down this Blog but I just want to highlight it because it is a great opportunity for Readers of whatever experience level to come along and meet up with some very experienced and helpful Investors. Newbies are particularly welcome.
And my Week was tempered by the performance of my Portfolio with it ending up down 1.0% with lots of my Stocks just drifting lower and my Index Hedges hurting me as the Markets managed to climb a bit. For 2019 so far I am just hanging on to the positive but only by a small amount although my Income Portfolio is doing quite well which cheers me up a bit. Of course in reality my Hedges are a form of Insurance Policy and the recent weakness has been a clear demonstration of how my Hedges are too big really and when the Markets fall my Portfolio tends to do well – it is a weird situation.
Sadly the recent drop didn’t last long so I wasn’t able to get the Shorts reduced but I am very happy to let them run because I suspect they will go my way around the Autumn if not before. There are signs now that the Markets could hold up through the rest of Summer but I will look closely at the Index Charts further down this Blog and see what is being flagged up. I look at my Hedges as ‘Profit Deferred’ and at some point we will get a hefty drop and then my Profits will be delivered. The only annoying bit is that the Hedges have a cost which is quite high but it is better for me to let them run than to Close them only to find I do not have Shorts on when I need them. Markets tend to drop fast when sentiment turns. As always there are myriad Economic issues kicking around such as weak growth from the UK, weak growth in Europe, Trade Wars from Trumpy between US and China and tensions around Iran which have taken quite a nasty and violent turn. Anyway, there are always things to worry about in the Macro Environment and my approach is to pretty much ignore it all and just focus on what the Index Charts are signaling – as always Charts contain a huge amount of predictive information and it is a great way to ‘Cut out the Noise’ and try to be as objective and rational as possible. June is historically a very bad month and this then leads to July which is a lot better. So far we have bounced a bit in June and it looks like we might not follow the usual pattern but if this happens then it is likely that July will be weaker than usual – there is always a price to pay when Markets move fast in any particular direction and ‘Mean Reversion’ is a very powerful force. In terms of my Strategy not a lot is changing. I will keep my Shorts on as protection especially with the Brexit Joke and potential for much more political upset and potentially a risk of a Corbyn Government although thankfully this is not all that high and even if the Commie Anti-Semite was to be elected Labour would only be a Minority Government and therefore unable to put through many of their insane policies via Parliamentary votes. So I am not doing very much and just letting my Cash slowly build although I am very intrigued by Live Company Group LVCG and am toying with the idea of taking a very tiny ‘Starter Position’ just so I have my foot in the door. I am waiting on a Broker Note which is due out and to see what kind of Forecasts they are predicting and this will enable me to take a better view on the valuation. It is a high-risk situation and not the sort of thing I go for much but the Results last week had a lot of good stuff in them and the way they are announcing a continuous flow of new BRICKLIVE Shows is very appealing to me. Of course I will keep Readers informed via Twitter and stuff with regards to what I am doing. I am also very keen on HOTC and will probably buy this as some stage although I still have some thinking to do which writing Part 2 of the Blogs will help with. Apart from that there are a few Stocks which take my fancy but I am not in a rush to do anything about those yet. Blog Slate As I mentioned I have an unusual highly personal Blog in a very good Draft state and I expect to finish that and publish it this week. It has actually worked out quite well because I have long thought that Readers might find a Blog about what my Spinal Injury really means and this recent escapade with A&E has given me an opportunity to weave in lots about my condition. I am sure Readers who know me ‘in the flesh’ in particular will find it an intriguing read. Once that one is done I will move on to the Second Part of the HOTC Blogs and that is likely to appear in 2 weeks time – with markets like they are I am sure this delay won’t matter much although I think HOTC has Results quite soon so I would like to complete my Research before then. Last Week I put out a Blog that is more about Bike Racing than anything else and I had been holding this one back as a reserve but had intended to put one out that I have in Draft form about how Share Prices can be viewed as like ‘Options’. However, when I got round to looking at it on Friday I realised that it actually needs a lot more work so I simply didn’t have the time to finish it – once the HOTC one is done I may pay more attention to that but by then something else might take my interest and be more enjoyable for me to write. I am aware that I have not managed to update the ‘Weekly Performance’ page for the month of May yet and I will try to do that as soon as I get a chance. Don’t forget the TPI Podcast we put out recently – as always there is a Link on the ‘Podcasts/Videos’ page (which reminds me I must swap the Videos bit out into its own page at some time). I also have loads of Non-Fiction Book Reviews to issue but these are not a priority. Gaydon Museum Meet-up You can find out details about this one on the ‘Events’ page and the crux of it is that I will be at the National Heritage Motor Museum at Gaydon just off one or other motorway (it’s a bit below Birmingham I think) on Friday 12th July. Again everyone is invited and you just need to pay the entry fee to the Museum but it is well worth going and we should have a good laugh. Come and join us. I am not too worried about knowing who is coming because it is a huge venue and a public place anyway. Generally these kinds of Meet-ups tend to be smaller with perhaps around a dozen people or so which means that if you are new to investing or anything then they can be a superb opportunity to meet up with the highly experienced and successful Investors who I know are coming along. It is well worth taking advantage of. WheelieBash 2019 You can find out more details about this on the ‘Events’ page which is on WD2 (there is a Button at the top of the main Homepage on the main Website and you are actually reading this Blog on WD2 even if you hadn’t realized so if you go to the top of the Page you should find the Menu to get you to the ‘Events’ page) and it is taking place on Saturday 7th September and I can confirm that it will be held at the same venue as last year - the White Hart in Winkfield which is just outside Windsor. There is a link on the Events page to the Pub and everyone is invited but please contact me somehow if you are coming because I need to keep track of the numbers - we are allowed 60 People and it is pretty likely we will get that I think - the List is filling up fast with 20 confirmed attendees already and a lot of people at Mello said they are interested and will let me know (and that was not prompted by me). From the Vaults at Wheelie Towers Here’s one from back in March 2017 which Readers might find a useful refresh: http://wheeliedealer.weebly.com/educational-blogs/how-i-manage-so-many-stocks Right, let’s see what the Charts are predicting…… S&P500 As always I have taken the Charts from SharePad and if you click on the images they should grow larger so you can see more detail. First off I want to look at some ‘longer-term’ Indicators as there have been some key developments on these over the last week. My Chart below has the 13 and 21 Day Exponential Moving Average Lines for the S&P500 and where my Green Arrow is we have just had a Bullish Crossover where the ‘faster’ Black 13 Day EMA has passed over the ‘slower’ 21 Day EMA which is the Red Line and this suggests weeks of gains to come. Of course any Signal/Indicator can quickly be reversed but I tend to find that these Crossovers are highly reliable so it sort of flies in the face of the usual outlook for Summer and end of June in particular of weakness. 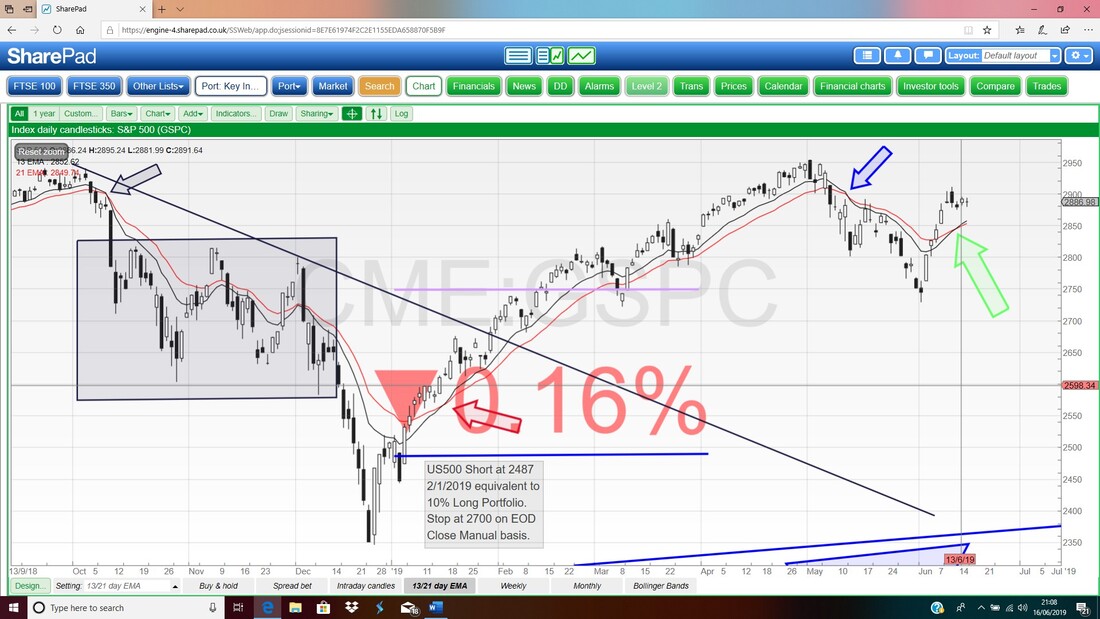
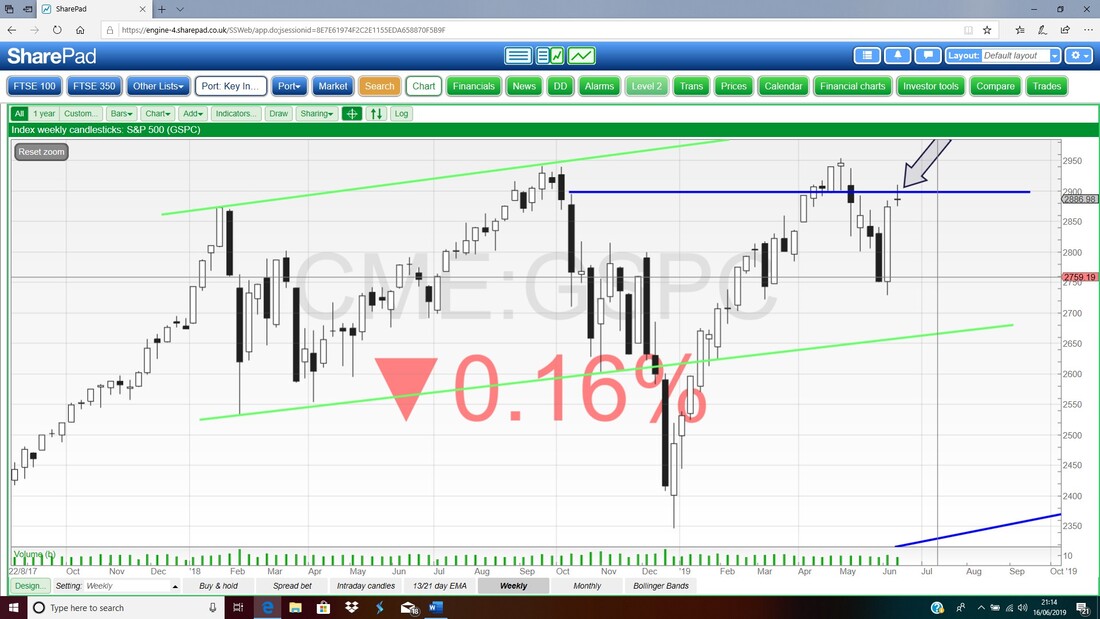
The next Chart is particularly interesting. My Black Arrow is pointing to a possible ‘Shooting Star’ on the S&P500 Weekly Candlesticks and after the strong move up with the big White Candle of the week before, this could be the start of a turn down. It’s not a strong ‘context’ as really a Shooting Star would have a lot more force and reliability if it followed a sustained move up for several weeks, rather than merely one week.
Next we have the Daily Candles for the S&P500. Where my Black Arrow is we had a small ‘Star Doji’ type of Candle from Friday and this tells us that neither the Bulls nor the Bears were able to really take control and for much of last week the S&P500 was just going sideways. If you go back to Tuesday 11th June that was the High of last week at 2910 and this is Resistance that needs to be gotten over if the S&P500 is really going to make progress upwards.
To the immediate downside the Dark Blue Wavy Line which is the 50 Day Moving Average is slightly below where the S&P500 is now and this is at about 2874 and a Daily Close below this might be a worry. If things do drop away then Support kicks in from where my Green Arrow is and this is at about 2728 – a Daily Close below 2728 would suggest more falls to come. 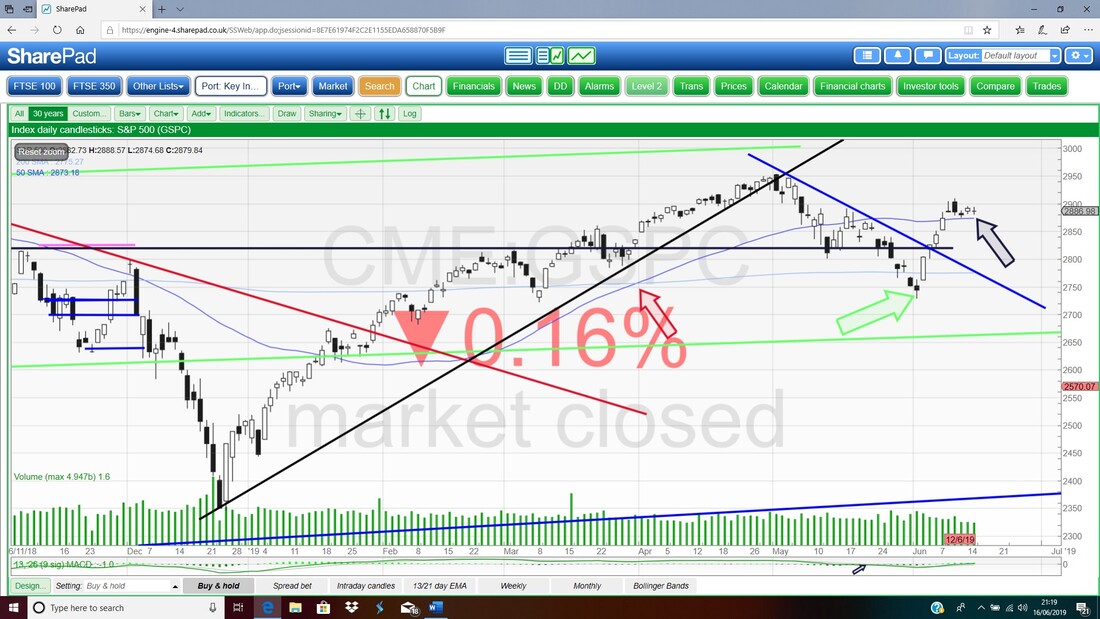
In the bottom window on the Screenshot below we have the RSI (Relative Strength Index) for the Daily S&P500. On a Reading of RSI 56 this is a very neutral level and by definition this is neither Overbought nor Oversold – it could turn down from here but that would be unusual really and such turns downwards tend to come when the RSI is much higher.
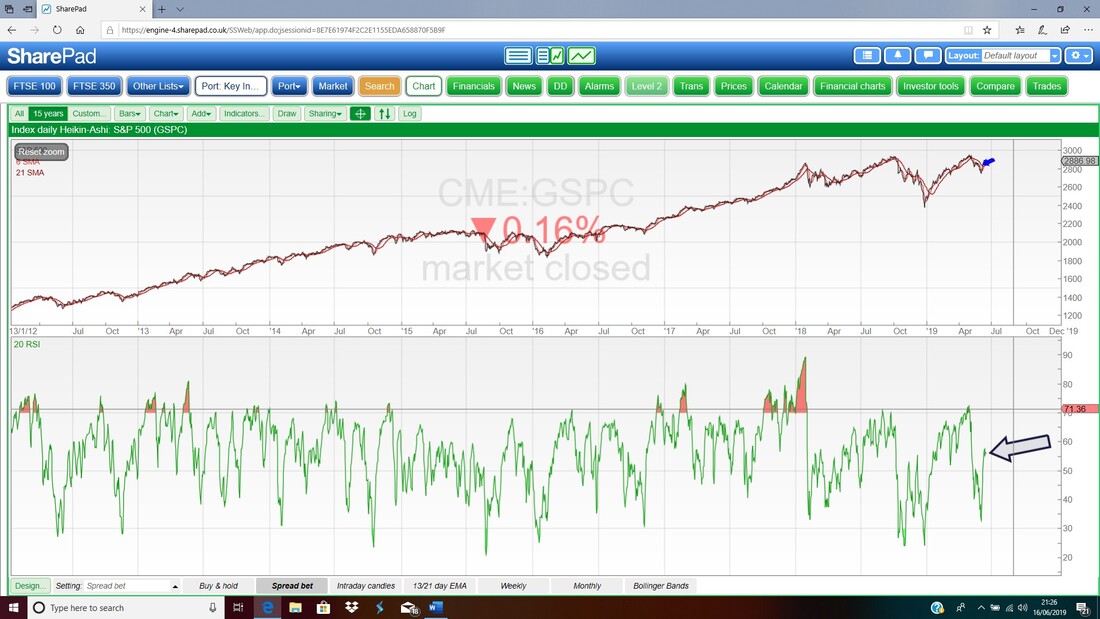
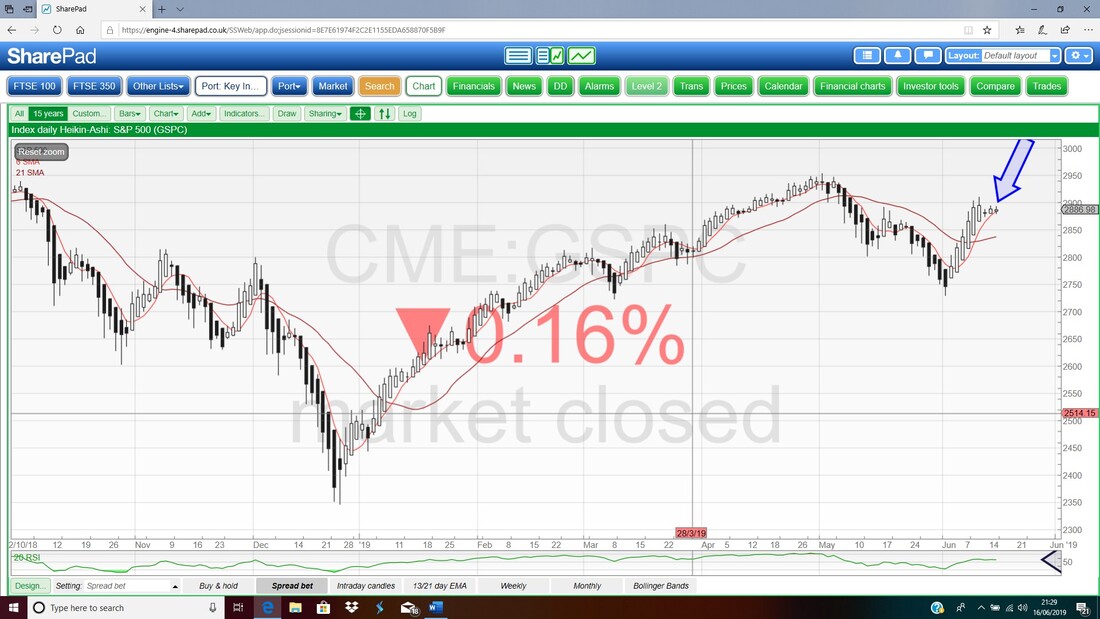
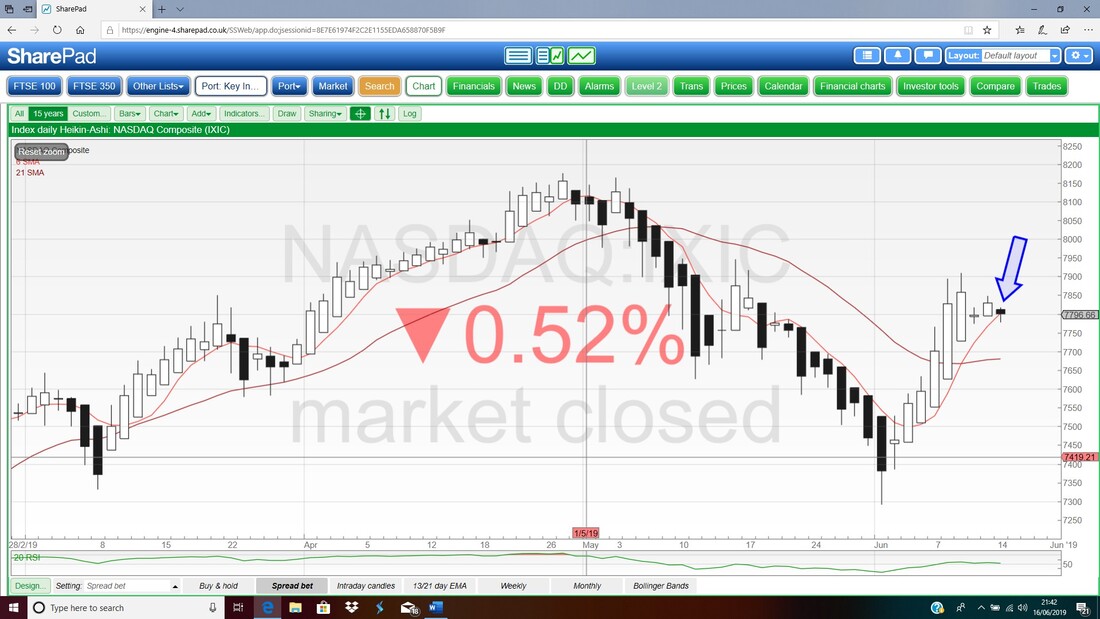
The Screen below has the Daily Heiken Ashi Candles for the S&P500. These things are extremely simple and in essence are Black for bad news and White for good news. My Blue Arrow is showing where the Candles have become narrow but are still White – this suggests they might be about to turn to Bearish Black so we need to watch this.
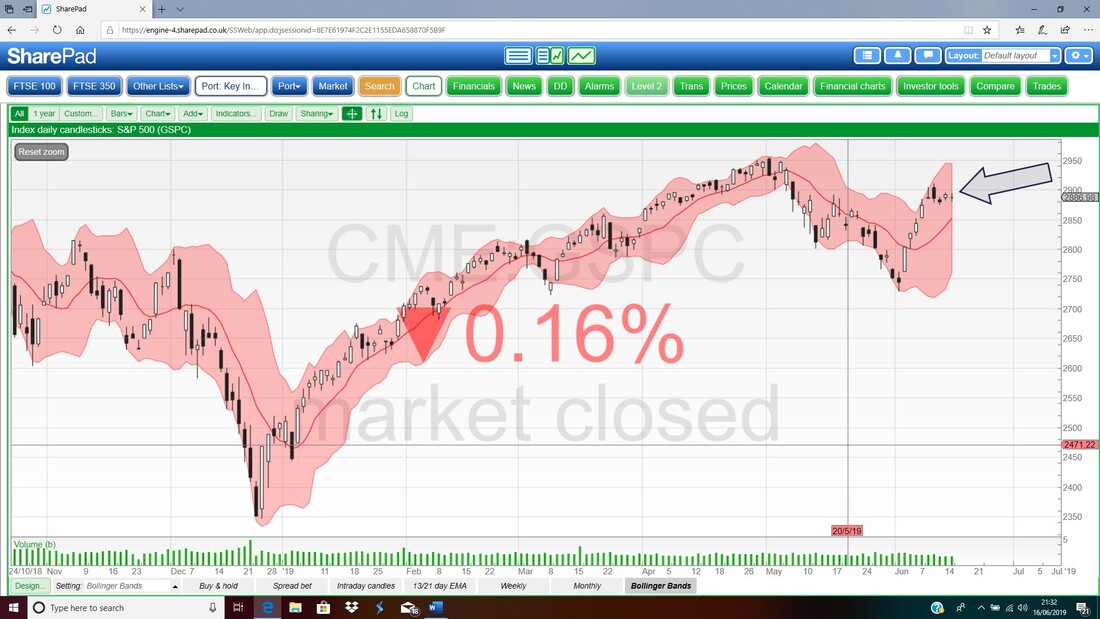
The next Chart has the Daily Candles for the S&P500 with the Pink Zone marking the Upper and Lower Bollinger Bands. My Black Arrow is pointing to where the Candles hit the Top Band back on Tuesday and have since that moved sideways.
Nasdaq Composite (US Tech)
The Nasdaq Composite Index is very much the same as the S&P500 but I do note that on the Weekly Candles we have a much more distinct Bearish Shooting Star as pointed at by my Black Arrow on the Chart below. 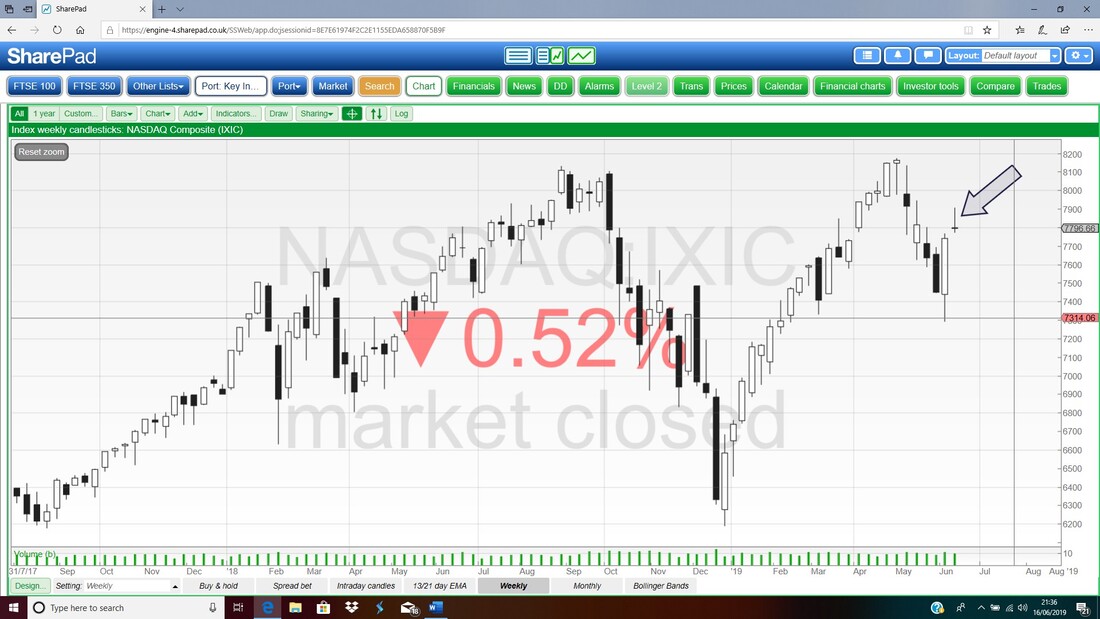
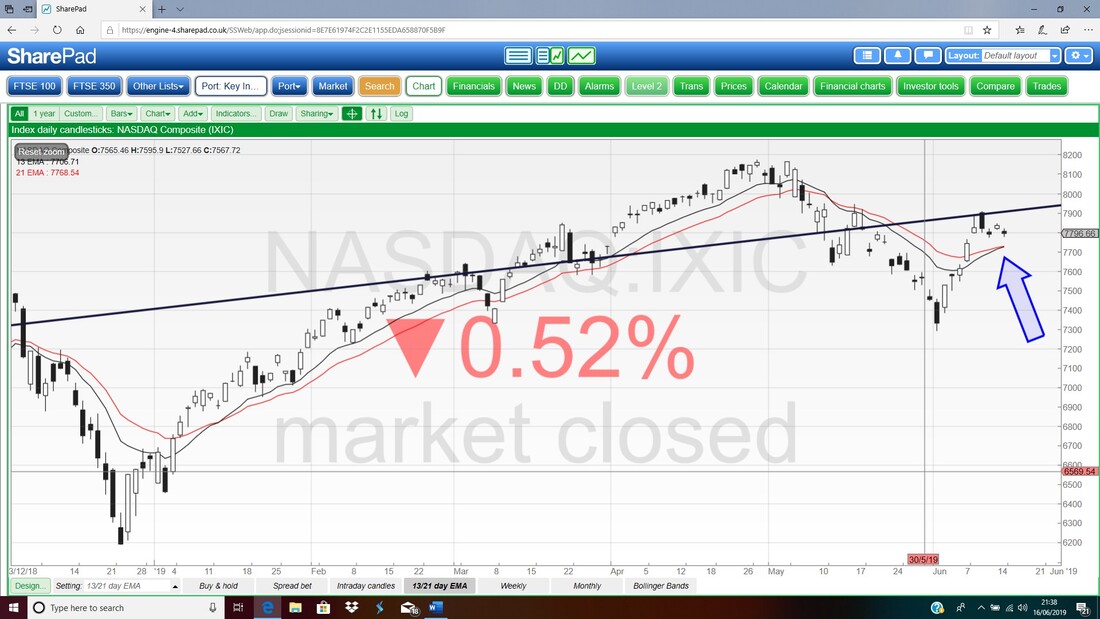
Keeping on a similar theme, my Chart below has the Daily Candles for the Nasdaq Comp and my Blue Arrow is pointing to where the 13 and 21 Day EMAs are touching – so a Bullish Crossover could happen very soon but equally it might turn down and this could be just after a ‘False’ Signal of a Bullish Cross.
Another interesting Chart below. My Blue Arrow is pointing to where the Daily Heiken Ashi Candles for the Nasdaq Comp have turned to Bearish Black – if that signal comes true, then expect falls in coming days.
FTSE100
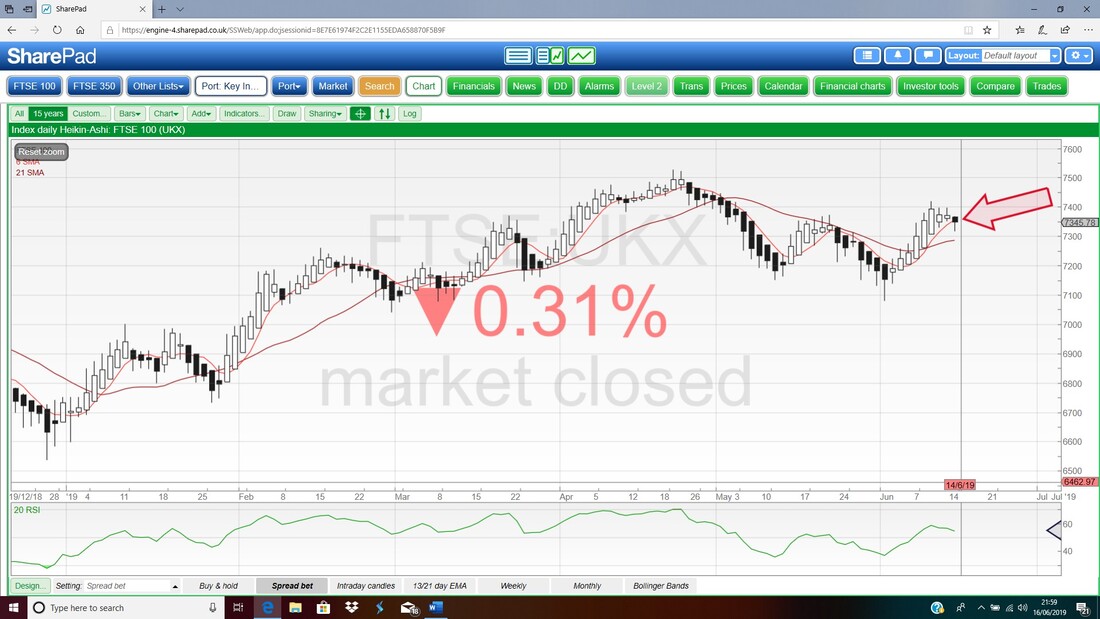
My Chart below has the Daily Candles for the FTSE100 but my focus is on the 13 and 21 Day EMA Lines and my Green Arrow is pointing to where we have just had a Bullish Crossover. This suggests weeks of gains ahead and is usually a very reliable predictor of this but if the US Markets turn down then we might find that the FTSE100 drops with them. This is particularly possible at this time of the year. 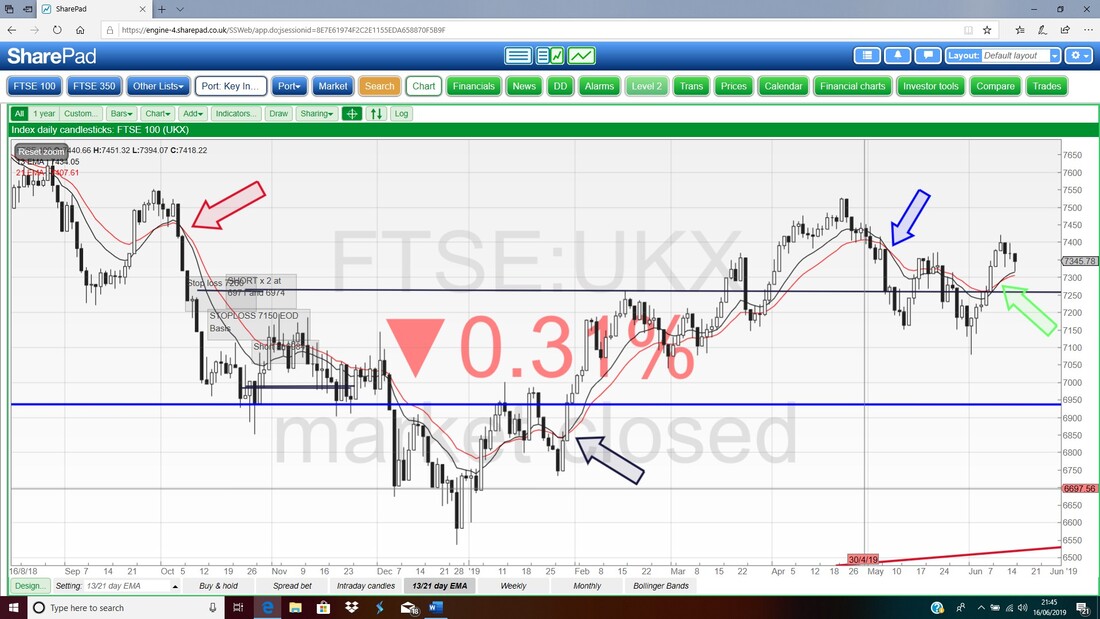
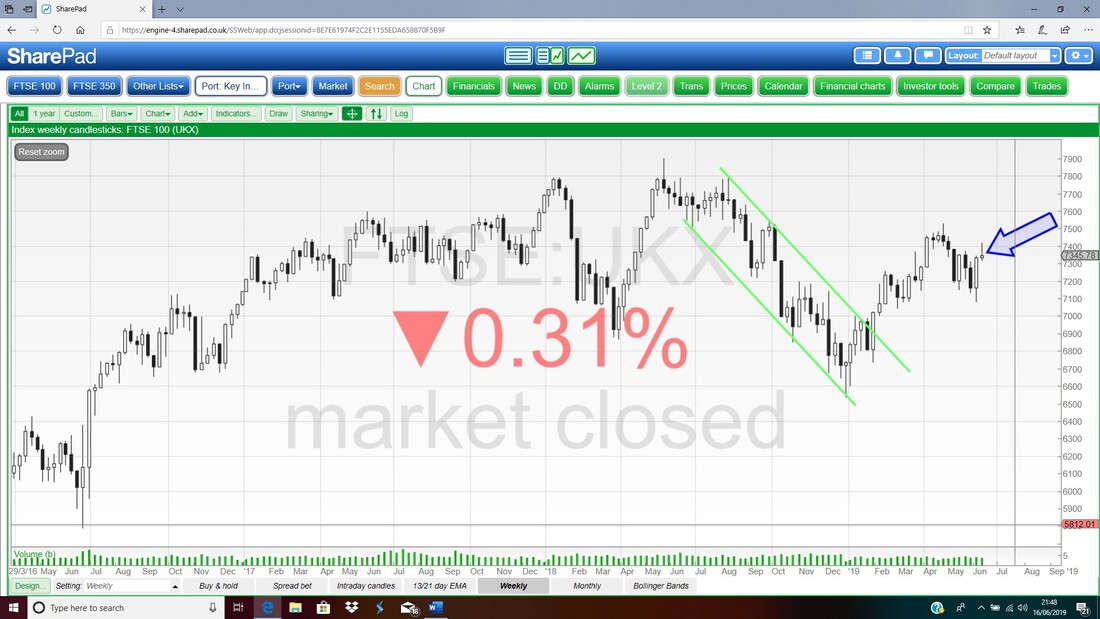
Next it’s the Weekly Candles for the FTSE100 and my Blue Arrow is pointing to a Shooting Star like we saw on the Nasdaq Comp. This could suggest weakness ahead.
Next it’s the Daily Candles for the FTSE100. My Red Arrow is pointing to a Down Candle from Friday but note it recovered off the Low at 7316 and this is now important near-term Support and if this fails then we could go much lower.
To the upside, there is Resistance at 7420 which is from Tuesday 11th June and this must be broken through to go higher. Where my Blue Arrow is we have very strong Support now at 7079 and if this Level were to fail then we really could be in trouble. Higher up, where my Black Arrow is there is very strong Resistance at 7528 and this could be hard to get over. 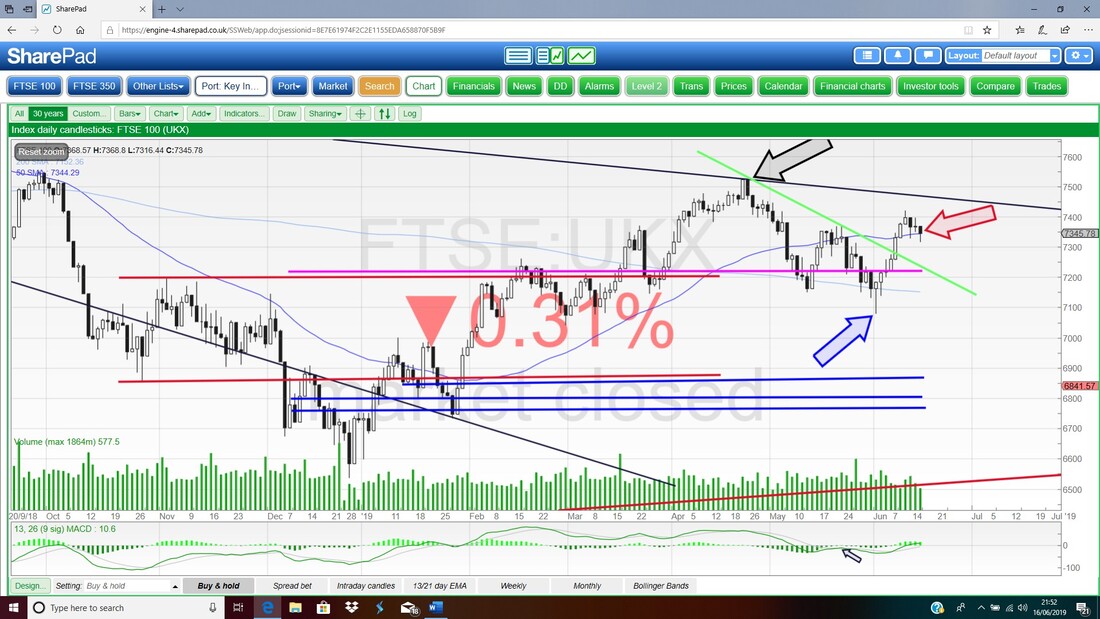
In the bottom window on the Screen below we have the RSI for the FTSE100 Daily. On a Reading of RSI 55 this is neutral and doesn’t tell us a lot.
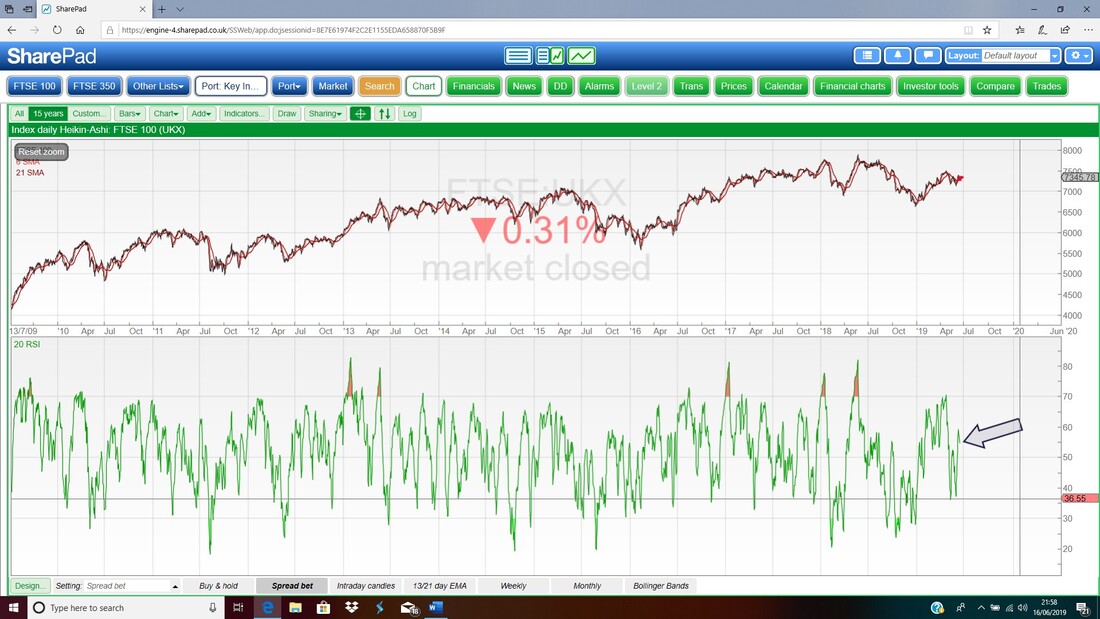
Next we have a potential problem. This Chart shows the Daily Heiken Ashi Candles and my Red Arrow is pointing to where the HA Candles turned colour to Bearish Black on Friday.
Next it’s the Daily FTSE100 Candles with the Pink Zone marking the Upper and Lower Bollinger Bands. My Blue Arrow is pointing out where the Price has dropped away from the Upper Band.
OK, that’s it for this Blog, Good Luck in the coming week. Cheers, WD. 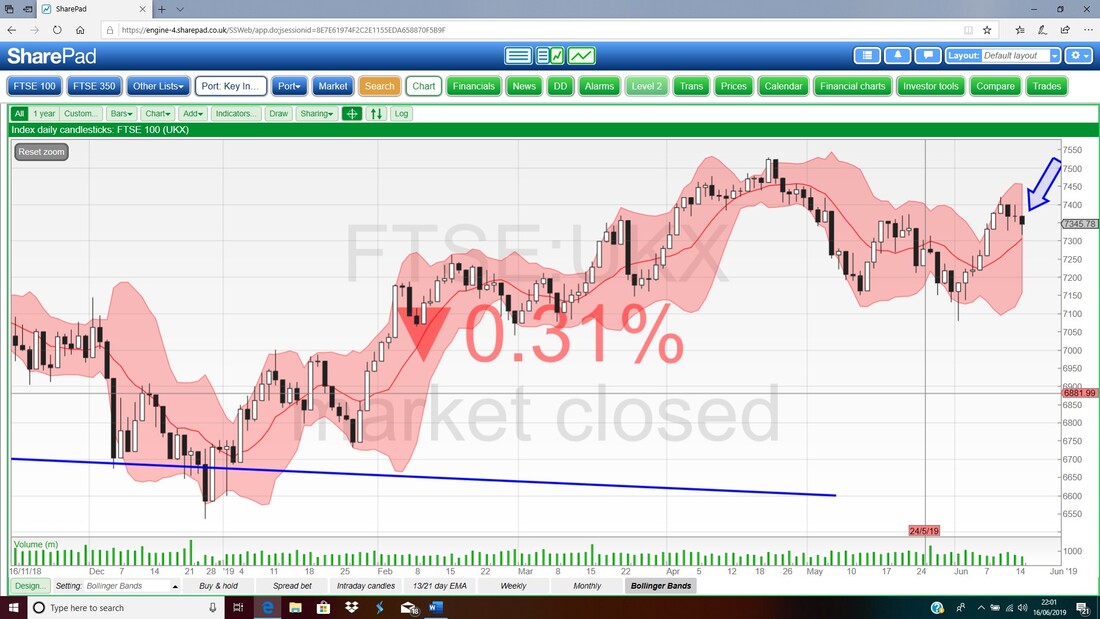
0 Comments
Leave a Reply. |

Stocks & Markets WheelieBlogsThese tend to be more Markets and Stocks related and timely - the Blog Page on the Main WheelieDealer Website has the 'Educational' stuff (well that's the theory anyway !!). Archives
October 2021
Categories
All
|
