

|
stocks & Markets blog |
|
I am being all boring and sensible tonight and using the extra time provided by the Bank Holiday Weekend to make a good start on the Charts Blog (it is Saturday 20th) and mean that on Monday Night I only need to shove some Charts in - well that’s the plan anyway and should mean I can squeeze the text for this part out in a leisurely fashion and should make my task on Monday a lot easier.
Last Week Bit of a frustrating Week for me because I had steadily been clawing back the damage to my Portfolio as the Stocks outperformed the Index Hedges recently and it looked like last Week would continue this trend but then on Friday it all went pear-shaped and I ended up flat on the Week. This means my Portfolio is down about 1% on the Year so far and I need to get those Hedges unwound but need a decent drop to enable this. Fingers crossed as we ease into Summer we might see a bit of weakness in the Markets and that is of course highly likely in the Autumn with September being historically the worst Month and October being a very strange Month that usually works out OK but is notorious for many of the biggest Falls in history.
Just to reiterate, we are nearly at the end of April and of course next Week is another short (and therefore expect ‘weird’) one and then we get into May which is historically the second worst Month - so the portents are not great and of course it coincides with “Sell in May and go away and don’t come back until St Ledger Day” (or Brexit Day if you prefer that bewitching yardstick !!).
On Monday 22nd our Markets are closed but the US is open so when I do the Charts bit I will leave the US ones until last so that they have closed when I start writing about them. I recorded another TPI Podcast with @conkers3 on Friday and in this we go into a fair bit of depth on our thoughts around how the Markets look now and we also look at Telecom Plus TEP which I think is a very interesting long-term one at the moment. You can listen to it here: https://soundcloud.com/user-479955511/wheeliedealer-conkers3-talk-about-a-stock-that-is-up-7444-ytd-returns-ai-tep-jd-more On the Brexit front, not much has changed really with the useless Politicians being on their Easter break, but a couple of things worth tracking are that Theresa May is coming under a lot of pressure from the Tory Party ‘grass roots’ with Chairmen at over 70 local parties calling an Extraordinary General Meeting to discuss her leadership and to hold a vote of ‘No confidence’. If the Tory Activists vote against her (which is extremely likely) then it must result in a Leadership Contest and this could open up the possibility of a General Election etc. (and I doubt the Markets would like the uncertainty of another Election). The other thing of note is that Nigel Farage’s Brexit Party seems to be getting a lot of traction in the Polls for the EU Elections - this is a huge threat to the Tory Party and another reason for Theresa May to get ditched and a new Leader installed. It is highly likely that any new Leader calls an Election because the lack of a Majority in Parliament will mean that whoever takes over the helm will have the same challenges. An Election would be framed as ‘Tories mean Brexit and Labour are all over the place.’ So of course my Strategy remains the same of staying Hedged and being alert for opportunities to get out of this uncomfortable positioning - if I can sense a proper Sell-off coming then I would like to add to my Shorts a little bit so that in effect I am ‘Averaging Up’ but I will use a strict Stoploss on any additional Shorts I put on. In terms of Stocks I am pretty much doing nothing. The Value of Technical Analysis Nicole Elliott, ’The Trader’, in this Week’s Investors Chronicle (dated 18th to 25th April 2019) starts off with the following chunk of text: “I have been told, and I sort of believe, that most of my readers know little - and don’t care for - technical analysis. What can I say? More fool you; sharpen up, because you can do a lot better. If you want to do something well, like investing your money carefully and profitably, why not take a tip from the pros? They use all sorts of tools, including insider knowledge, hunches, ratios, comparisons - and have, front and centre of their screens, charts. Either as a short-cut aide-memoire, or to spot market extremes, their next area of research is technical analysis itself.” I couldn’t agree with this more and I regularly get people on Twitter etc. commenting to me that they don‘t use Charts and see it all as ‘mumbo jumbo‘ or ‘tealeaf reading‘. I am sure that if you are reading my Weekend Blog then you are probably already of the view that Charts can help with Investment and Trading and in many ways you are most likely already a convert to this philosophy. These Blogs contain a heavy dose of Charts with a particular focus on the Indexes but with Stock Charts occasionally bunged in as well. However, if it is not the case that you already fully avail yourself of the advantages of ‘Chart reading‘, then it is worth weighing up because it is very possible that by embracing the simple concepts and disciplines inherent in Technical Analysis, then you will improve your Returns - and if you are at that point in your Investing ‘Career’ where you are at a bit of a dead-end and struggling to find new areas to learn about, then a study of simple TA could be a very rewarding track to go down. When I think about all of the best Investors and Traders I know, literally none of them ignore Charts and all of them take notice to some extent. The key is to keep it simple and don’t get bogged down in too much technical wizardry which in reality just over complicates things and makes the task even more difficult. Keep it Simple, Stupid. WheelieBash 2019 I have been in liaison with Aston Girl @Reb40 and we have decided on Saturday 7th September for this year’s ‘WheelieBash’. I haven’t put much more thought into it than getting the date nailed at this stage, but my intention is to hold it at the same place as before because the feedback I get from Attendees is very favourable (I worry our judgement is being skewed by the wonderful weather we have been lucky to experience at the previous Bashes !!) and it ticks all the right boxes with decent Beer and hearty home-cooked type food and a huge garden. The White Hart at Winkfield near Windsor is the usual place (I need to confirm with Phil the Landlord but he really likes our crowd and I know he will do everything he can to fit us in) and you can see it here: https://www.thewhitehartwinkfield.co.uk/ As usual attendance is FREE and you just need to rock up when you like (I will probably get there about 12 noon ish) and you can stay as long as you fancy. We tend to get a great crowd with a total mixture of ages and skill levels and Newbies in particular will feel right at home and no one judges anybody or anything like that - it is a superb atmosphere of like-minded people who are all trying to do their best to take on the Markets and extract some dosh out of them. It is very much a shared endeavour and an almost unique opportunity to meet up with many outstanding Investors and Traders who are more than willing to share their knowledge and experience. If you go to the ‘Events’ page on the WD2 Website (there is a Button on the main Homepage) then you can see photos from last year’s Bash and we had to limit it to 40 people last year but I had a long chat with Phil and he reckons we can go up to 60 people - so that is what we must try for !!! If you want to come along, then please contact me somehow (email might be best on [email protected]) and I will put you down on a List that I just created !! I will confirm the venue nearer the time (if it is not that pub, then there are gazillions of superb Country pubs not far from that one) and look forwards to seeing you there. Mello Chiswick 15th May to 17th May It is now official that @conkers3 and myself will be in effect doing a ‘LIVE’ TPI Podcast at this Mello Event on Friday 17th May - we are yet to confirm the timings, but it will probably be around Lunchtime. These Events are without doubt the best Show for Private Investors who focus on UK Stocks and there is an impressive list of Companies attending and I know a lot of Private Investors who will be there and I have found both previous Mello Events I have been to to be really friendly and like the WheelieBash there is a great atmosphere and they are well worth attending. You can see what it is all about here: https://melloevents.com/ At the moment there is a special Discount of 50% which is huge slice off the Price for the Tickets UNTIL MAY 1ST and you can get that by using Discount Code ‘EB50’ at this link: https://www.tickettailor.com/events/melloeventslimited/229964/ The format is that the Small Caps Event is on the Thursday and the Friday and on the Wednesday there is a Funds and investment Trusts Event - if you want to go to that one, it is another £10 (sounds worth paying a tenner on top if you are available that day). Blog Slate On Thursday I published the second Part of those Blogs on what I look for when reading Results Statements and Trading Updates every morning and you can find that on the ‘Educational Blogs’ page which sits on the main WD Website (yes, I know the layout is utterly confusing but over time you will figure it out and I promise that it will rarely change and anything I do alter will be minor and I will flag clearly what is different !!). Part 3 is pretty much ready and I intend to issue that later this Week. I had a flash of inspiration yesterday (I am convinced it is because I am feeling nice and relaxed and happy because the Sun is out and I have been out in Le Jardin de Wheelie mucking about with various sorts of muck !!) and I dreamt up the idea of a Blog about our own particular Investing ‘Universe’ and the thrust behind the Blog is that I read quite often that we should widen our ‘Opportunity Set’ but I actually think that is a questionable idea and that focus and specialism are more likely to give us better Returns - like almost everything in life you tend to achieve better outcomes if you act with tunnel vision. I have been going through a slow journey myself in recent years to actually retrench more to just the UK only and I am reducing my Opportunity Set by ruling out all sorts of things and I will explain this in the Blog. I wrote a very good draft of it last night so hopefully in a few weeks it should see the light of day on the Website. I have some others in reasonable Draft forms and I have an idea for another Blog which I have been meaning to start for a few Weeks but as yet I have been distracted by other Blog ideas - but I will start on that one soon I am sure because I have been promising it for years and it is only now that I am an MS Paint Black Belt that I can do it justice I think. And don’t forget to listen to the Podcast. If you like it and you have not heard any of our TPI efforts before, then it might be worth going through the Archive because we try to include a huge educational element in our recordings and they should be timeless to a large extent. From deep in the Basement…. I had to take the Lift down to the Dungeons to dig this one out but it is something I bashed out several years ago and it is probably well worth a refresher: http://wheeliedealer.weebly.com/educational-blogs/taming-the-bear-how-i-handle-nasty-markets OK, time for some Charts (these are after all supposed to be ‘Charts’ Blogs !!) FTSE100 I’m starting with a very busy screen so please just follow the pointers I give in the text. Oh, before we get stuck in I must just say that all Charts are ScreenShots from the excellent SharePad software stuff I use and if you click on the images they should grow bigger. On the Screen below of the FTSE100 Daily please note my Red Ellipse which captures recent Daily Candles which are above the Black Resistance Line that is marked by my Black Arrow - as long as it stays above this Line that is Bullish really. The Big Black Ellipse in the Top Left is important because it captures a wide Zone of Resistance from about 7500 up to the All Time High (ATH) at 7903 - this will probably be difficult to get up through, especially with Spring now springing and May being usually a tough month. My Blue Arrow is marking a Bullish ‘Golden Cross’ between the 50 and 200 Day Moving Average Lines - this is positive for the FTSE100 but note it is quite a ‘slow’ Indicator and the FTSE100 could easily turn down from here. 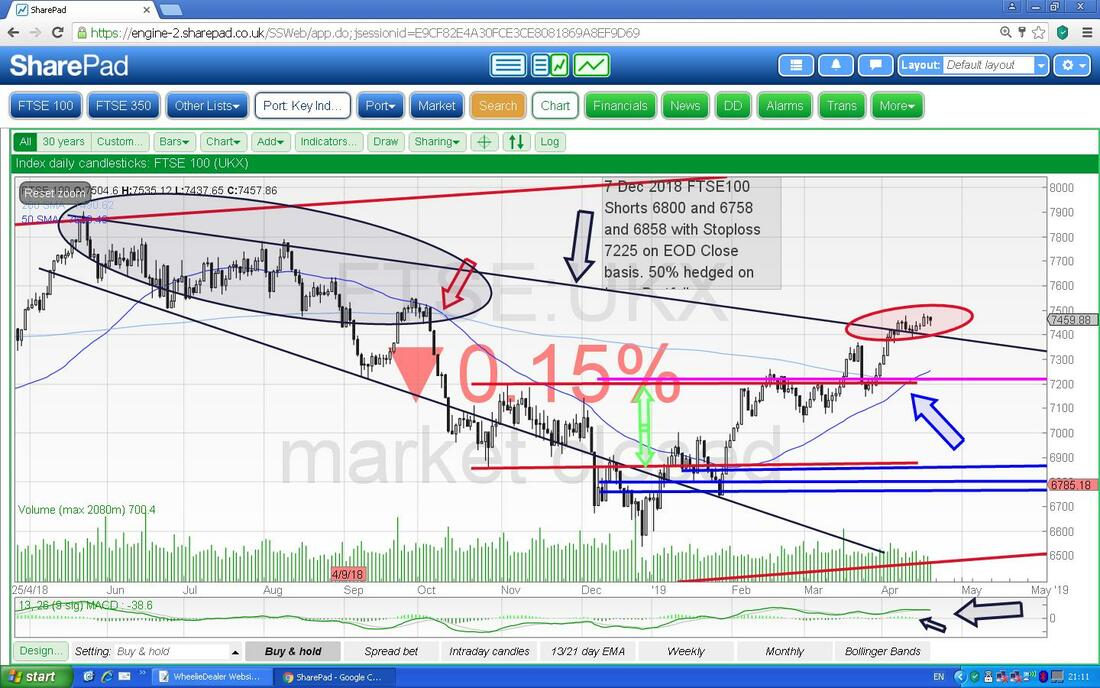
This is not a hugely reliable Indicator but it is worth noting - in the Bottom Window on the Screen below we have the MACD (Moving Average Convergence Divergence) for the FTSE100 Daily and my Black Arrows are pointing out that we are right on the verge of a Bearish MACD Cross in both the Signal Lines and Histogram Bar formats - there are no guarantees but it looks likely we could have a bit of Bearishness in the coming Week.
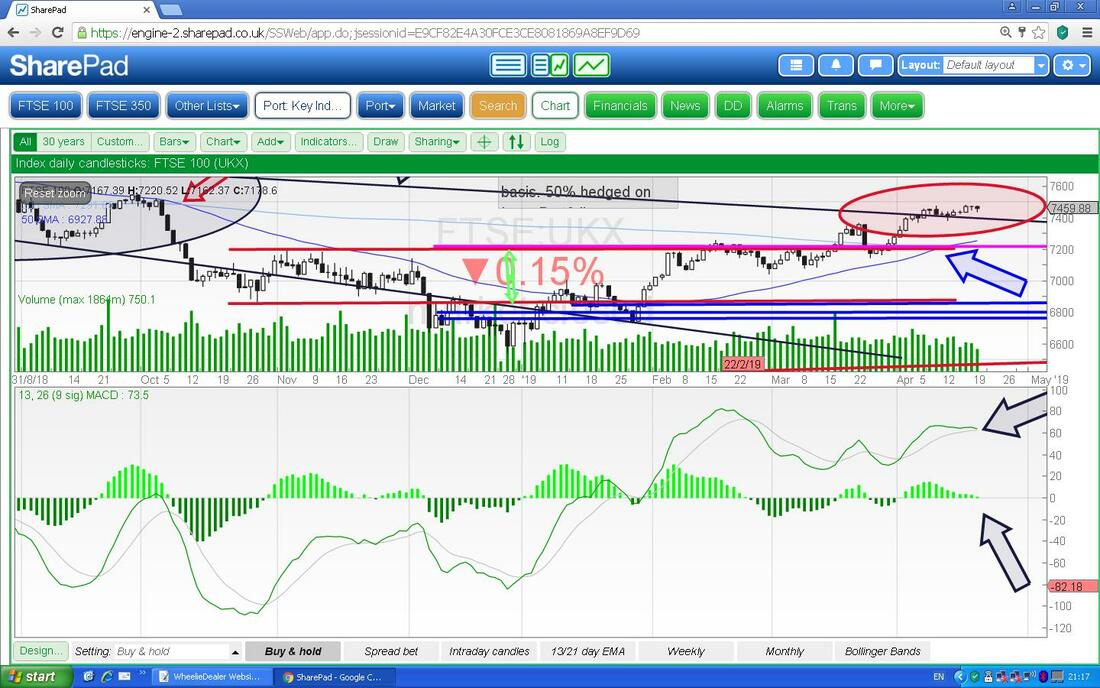
In the bottom window below we have the RSI (Relative Strength Index) for the FTSE100 Daily. My Black Arrow is pointing to where we are now on about RSI 68 which is a very high reading and a drop back is highly likely.
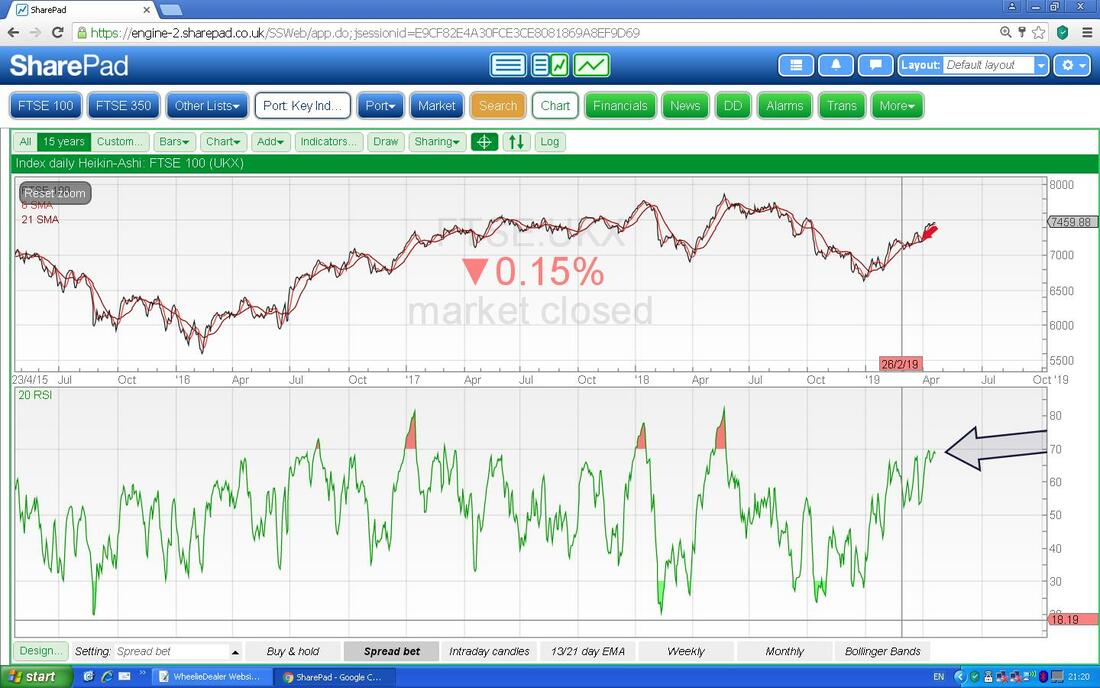
I mentioned this next concept on the Podcast and I might put a similar Chart in for the S&P500 if I have time (to be honest I expect a similar pattern). This time we have the RSI in the bottom window again but I have closed up the time period to go back to the tail end of 2017. First off look at my Red Arrow (not the tiny one in the top window - please ignore that) and note how we had an extremely high RSI Reading (up around RSI 78) and after that the Markets dropped into early 2018. In essence they had got very ‘Over-Bought’.
Next look at my Blue Arrow. Here we have another really high RSI up around 82 (that is a bonkers reading !!) and look how that ‘predicted’ the big drop in the Markets that followed from May 2018 right through to the end of the Year. So you might be seeing a Pattern here? Where my Black Arrow is we have a very High RSI reading up at RSI 68 - it is not as extreme as those two previous Examples so maybe we will go a little higher but without doubt RSI 68 is a very high level and we could easily fall from here. 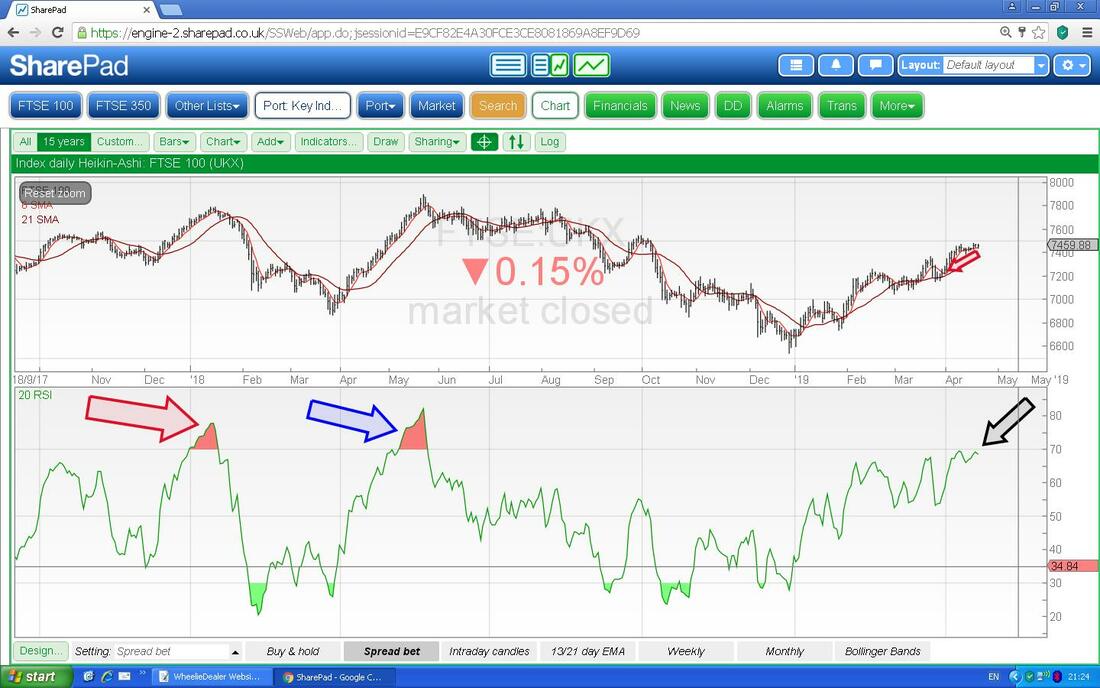
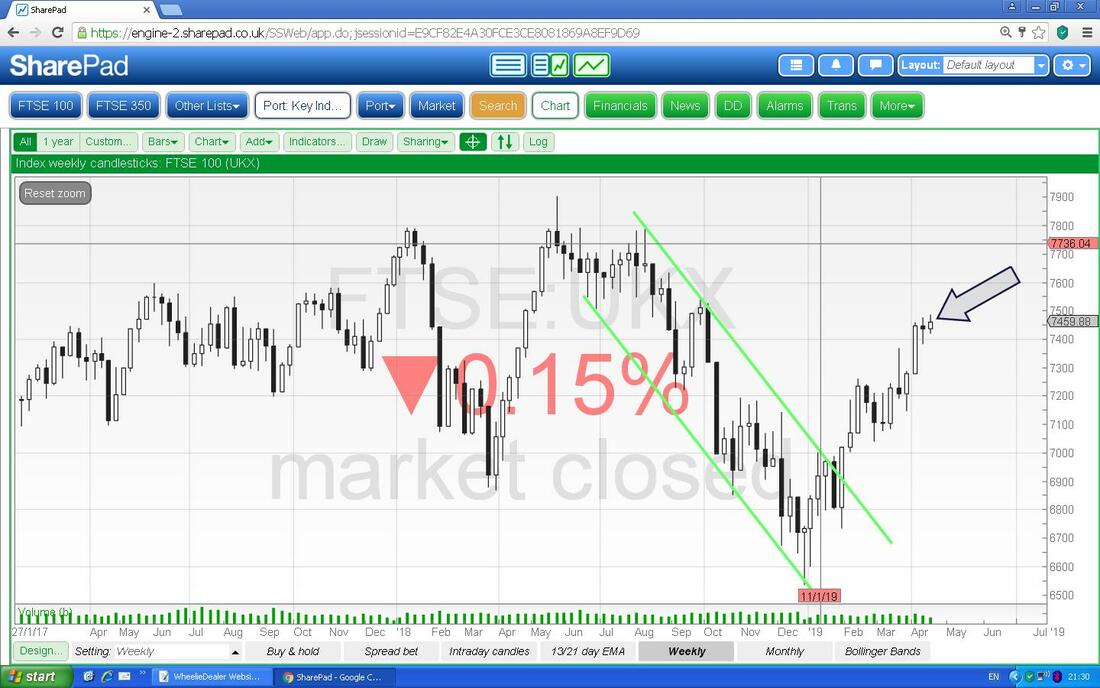
Next we have the Weekly Candles for the FTSE100. My Black Arrow is pointing to a small Doji Candle from Last Week and this followed another Doji from the Week before. This could easily be a Turning Point down and the key is the High of Last Week at 7486 - if it can get above that level then it wipes out the Bearishness (it is ‘best‘ and ‘cleanest‘ if it Closes above that level).
S&P500
The Chart below has the Daily Candles for the S&P500 going back to about September 2018. In the Top Left Hand Corner we have my Red Ellipse which is pointing out the Previous All Time High Candles with the Peak at 2941 and today the S&P500 Closed at 2909 so we are remarkably close to it. A Breakout above 2941 would be Bullish as we discussed on the Podcast - although you can get a ‘Blow-off Top’ in such circumstances - especially around this time of year. My Blue Arrow is pointing to a fairly steep Uptrend Support Line and note we are quite near it now - if the Price falls below this Line, then that would probably mean trouble ahead - especially if it Closes below that Support Line. The S&P500 gained today (it seems to follow the Nasdaq to a large extent) and a key nearby Level now is 2918 - a Close above this would be promising for Bulls. My Black Arrow is pointing to a Horizontal Line which was Resistance but now should act as Support (‘Previous Resistance becomes Support and Vice Versa’) and this is at about 2817. My sort of Pink Arrow is pointing to a Bullish Golden Cross between the 50 and 200 Day Moving Averages - these are not hugely reliable and are a ‘slow’ Indicator but of course this is positive. 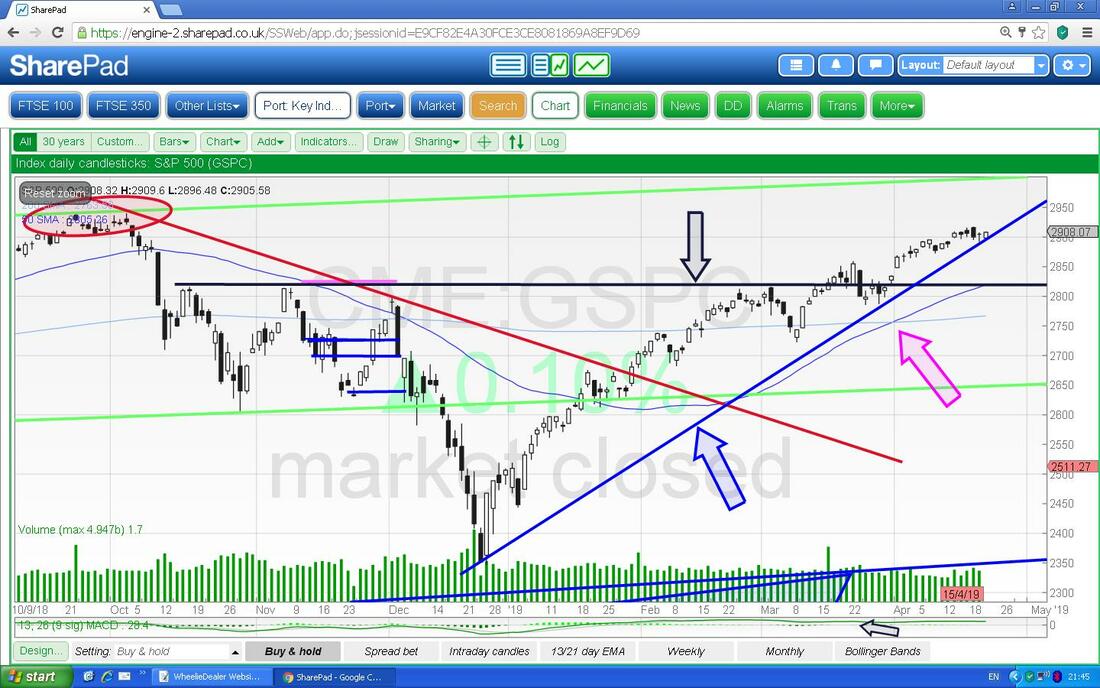
Here is the Chart I promised. In the bottom window, my Ellipse over in the left marks some crazy RSI readings and I remember vividly this happening because it was so unusual. We got readings up near RSI 89 and this was the end of 2017 and resulted in sharp drops in early 2018.
My Black Arrow points to RSI readings up around 70 which then led to falls in late 2018 and my Blue Arrow points to where we are now at about RSI 68 - so a drop now is very likely. 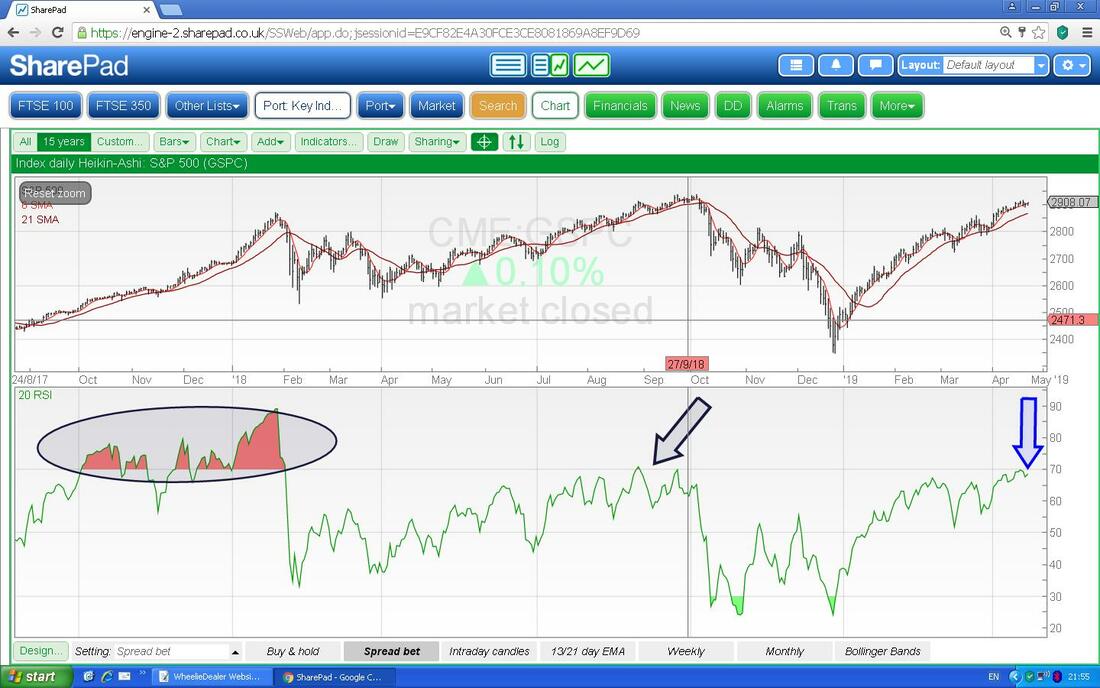
This next Chart is interesting. Here we have the Weekly Candles and you must ignore the small White Candle right at the end because it is for this current Week and not a valid Candle. My Red Arrow is trying to point to the Black Doji Candle from Last Week and this has a very Narrow Body and small Tails and it looks like it could be a Turning Point. A move above 2918 would negate any such Bearish concerns.
OK, I will knock it on the bonce there - I hope everyone has a good week and that you enjoyed the Easter break !! Cheers, WD. 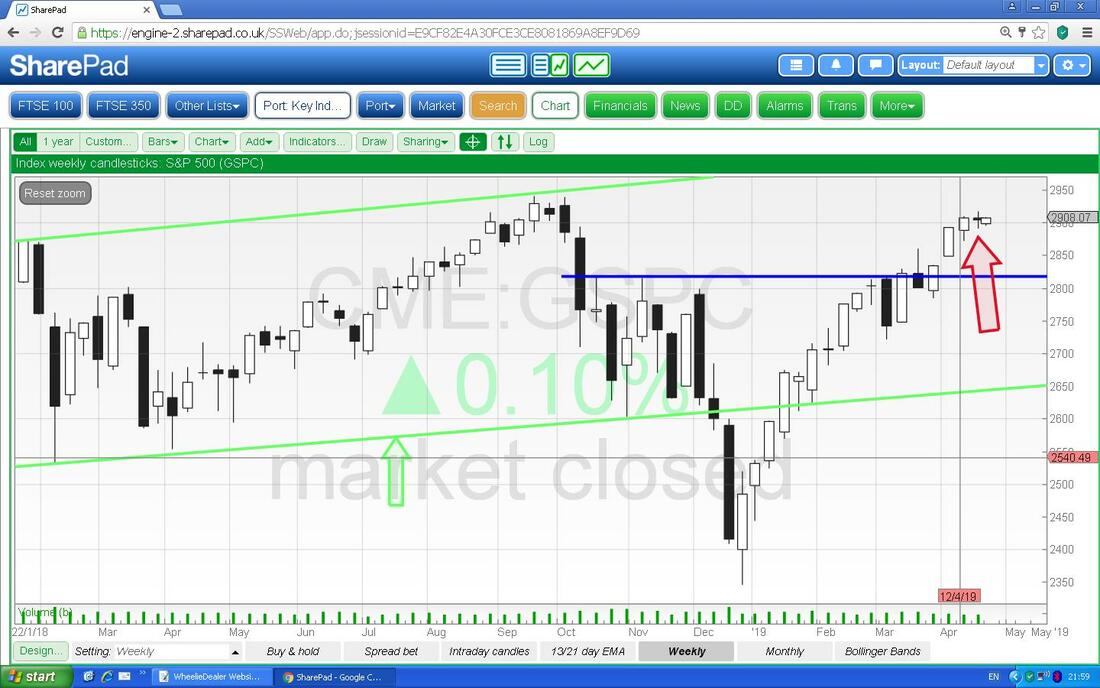
0 Comments
Leave a Reply. |

Stocks & Markets WheelieBlogsThese tend to be more Markets and Stocks related and timely - the Blog Page on the Main WheelieDealer Website has the 'Educational' stuff (well that's the theory anyway !!). Archives
October 2021
Categories
All
|
